Açıklama
🚀 cTrader için Volume Profile Pro
Fiyat hareketinin ardındaki gerçek yapıyı Volume Profile Pro ile açığa çıkarın, profesyonel cTrader traderları için özel olarak tasarlanmış güçlü ve tamamen özelleştirilebilir bir Fiyat Bazında Hacim göstergesi.
Bu gelişmiş araç, seçilen zaman dilimi başına bireysel hacim profillerini görselleştirir, böylece kurumsal aktivitenin tam olarak nerede yoğunlaştığını doğrudan grafiğinizde görebilirsiniz.
🔎 Ne Yapar
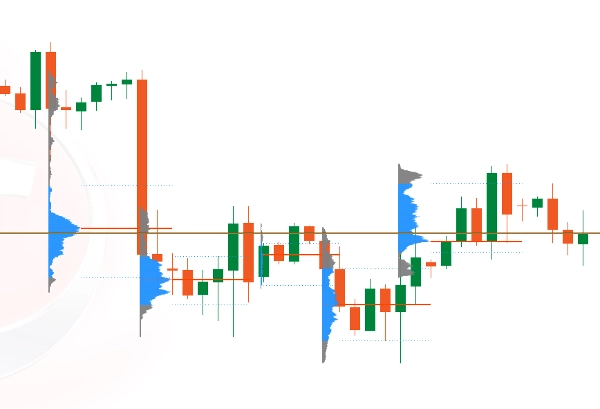
Volume Profile Pro, her tamamlanmış dönem (H1, M15, D1 vb.) için sabit aralıklı hacim dağılımını hesaplar ve fiyat ekseni üzerinde doğrudan çizerek hassas yapısal analiz sağlar.
Her profil:
- Dönem başına ayrı ayrı çizilir
- Tutarlı sabit fiyat aralığı kullanır
- Fiyat seviyesine göre hacim dağılımını gösterir
- Önemli kurumsal seviyeleri vurgular
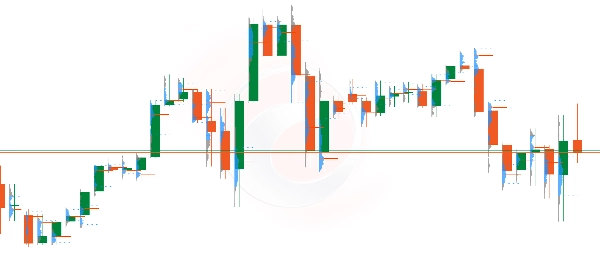
Profiller, fiyat hareketini engellemeden net yapı tanıma sağlamak için her mumun soluna temiz bir şekilde konumlandırılır.
⚡ Temel Özellikler
✔ Zaman dilimi başına bireysel hacim profilleri
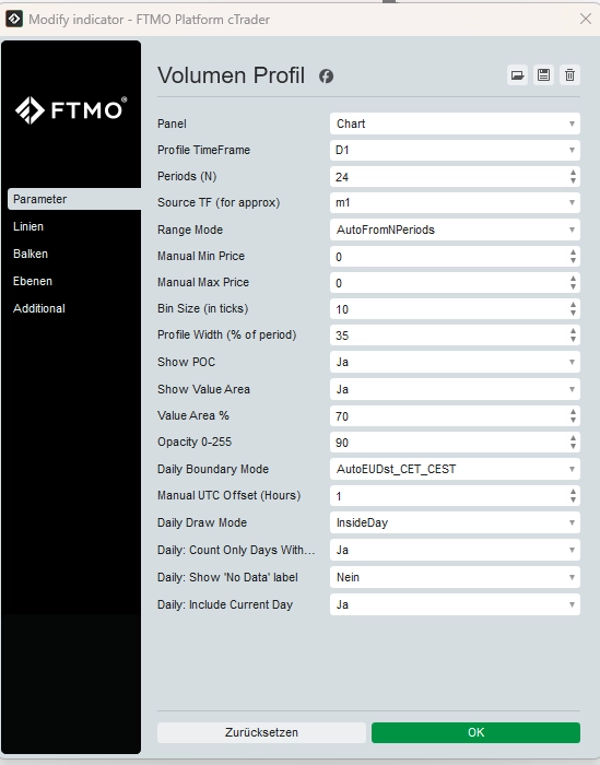
✔ Seçilebilir profil zaman dilimi (M15, H1, H4, D1 vb.)
✔ Sabit fiyat aralığı (otomatik veya manuel)
✔ Kontrol Noktası (POC) vurgulama
✔ Değer Alanı Yüksek (VAH) & Değer Alanı Düşük (VAL)
✔ Grafik titremesi olmadan akıcı render
✔ Performans için tamamen optimize edilmiştir
✔ CFD ve Tick Hacmi ortamları için tasarlanmıştır
📊 Traderlar Neden Kullanır
- Kurumsal birikim ve dağıtım bölgelerini tespit etmek
- Yüksek olasılıklı tepki seviyelerini belirlemek
- Kırılma gücünü doğrulamak
- Konsolidasyon aralıkları içinde girişleri iyileştirmek
- Hacim yapısını fiyat hareketi ile hizalamak
İster scalper, ister intraday trader, ister swing trader olun, Volume Profile Pro size yapısal bir avantaj sağlar.
⚠ Önemli Uyarı
Volume Profile bir ticaret yazılım aracıdır ve finansal veya yatırım tavsiyesi teşkil etmez.
Forex, CFD ve diğer finansal araçlarda işlem yapmak önemli riskler taşır ve sermayenizin kaybına yol açabilir.
🎯 Hassasiyet için Tasarlandı. Profesyoneller için Üretildi.
Piyasa yapı analizlerinizi bir üst seviyeye taşıyın ve netlik, güven ve kontrol ile işlem yapın.
Özet
Müşteri değerlendirmeleri
5 | 100 % | |
4 | 0 % | |
3 | 0 % | |
2 | 0 % | |
1 | 0 % |