


Açıklama
Ana Kavram:
Klasik destek ve direnç ölçümleri “tepki”: fiyat burada kaç kez döndü? CCZ ölçer “kabul”: fiyat burada ne kadar süre işlem görmeyi kabul etti?
CCZ dürüst bir ölçüm yapar: “Kesintisiz sırayla kaç mum bu fiyatı kabul etti?”
Yöntem:
1. Son fiyat dilimini alın ve her biri mevcut ATR'nin bir kesri kadar yüksekliğe sahip ince yatay bantlara bölün. Bunları raflar olarak düşünün.
2. Her bant için mumları inceleyin ve o bandı kesen en uzun kesintisiz seriyi sayın. Bir mum kaçırırsa seri biter ve sayım sıfırdan başlar.
3. En iyi serisi belirli bir eşik değerini aşan herhangi bir bant — örneğin altı mum (veya kullanıcının kendi kurallarıyla belirlenen) — bir bölge olur.
“Sırayla” kuralı tüm fikirdir. Ardışık üst üste binen mumların duvarı konsolidasyondur — adil değer rafı.
─────────────────────────────────────
│ │ │ │ │ │ │ │
▓ ▓ ▓ ▓ ▓ ▓ ✗ ▓ ▓
1 2 3 4 5 6 kaçırma 1 2
└── 6 sırayla ──┘ ↑ └ seri sıfırlanır
uygun boşluk
─────────────────────────────────────
Bölgeleri Okuma
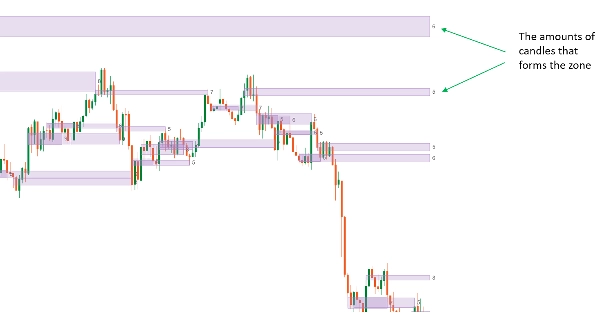
Her bölge, bir fiyat bandını kapsayan bir dikdörtgendir ve üzerinde bir sayı yazılıdır. Bu sayı, bandı tamamen dokunan mumların en uzun kesintisiz serisinin uzunluğudur — bölgenin güç puanı. "6" altı mumun art arda o fiyatı paylaştığını; "12" ise "6"ya göre çok daha rekabetçi bir seviyeyi ifade eder.
Bir bölgenin sağ kenarı, ilgili kaldığı sürece ileriye doğru uzanır. Fiyat uzaklaşıp sonra geri geldiğinde, bölge **azaltılmış** olur — test edilmiş ve uzaması durur. "Geri gelme"nin ne anlama geldiğini siz seçersiniz:
- “Dokunma” — bölgeye herhangi bir fitil geri dönerse azaltılır (katı)
- “İçerde kapanış” — sadece içeride kapanan mum sayılır (esnek)
- “Önce dokunma sonra içeride kapanış” — önce bir fitil, sonra içeride kapanan bir mum — tek fitilli reddetmeleri yok sayar
Azaltıldıktan sonra bölgeleri gizleme seçeneği, grafiği sadece hâlâ geçerli olan seviyelerle tutar.
Herhangi bir temel zaman diliminde bölge tespiti
Sayımı yapılan mumların, grafikteki mumlar olması gerekmez. Bir temel zaman dilimi bir kez ayarlayın — grafiğinizden daha düşük, eşit veya yüksek olabilir — ve bölgeler, hangi grafikte görüntülendiğine bakılmaksızın o zaman diliminin mumlarından oluşturulur.
M5 grafiğinden işlem yaparken H1 mumlarında çalıştırın, aynı H1 oluşturulmuş bölgeler her iki grafikte de görünür. M1'e yakınlaştırın, yine aynı seviyelerdir — farklı zaman dilimleri için farklı bir tespit değil, tek bir tespitin büyütülmüş görünümüne bakıyorsunuz.
Ayarlar
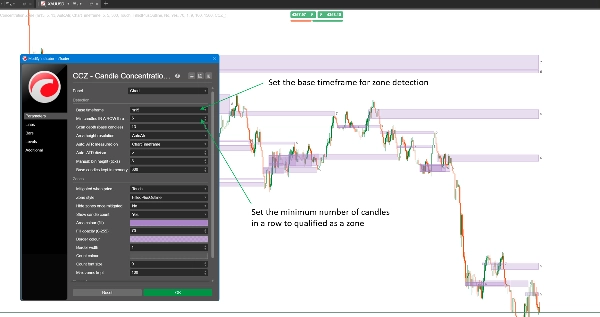
- Temel zaman dilimi — grafikten bağımsız, herhangi bir çözünürlük
- Bir bölgeyi nitelendirmek için gereken minimum ardışık mum sayısı
- Tarama derinliği — kayan pencerenin kapsadığı temel mum sayısı
- Alan yüksekliği çözünürlüğü: Otomatik (ATR tabanlı) veya Manuel (sabit tickler)
- Otomatik mod: ATR'yi grafik zaman diliminde veya temel zaman diliminde ölçme, ayrıca bir ATR bölen ile "aynı seviye" olarak sayılan bant sıkılığını ayarlama
- Bellekte tutulan temel mumlar
- Azaltma kuralı: Dokunma / İçerde kapanış / Önce dokunma sonra içeride kapanış
- Bölge stili: sadece kontur veya dolu + kontur, bağımsız dolgu opaklığı ile
- Azaltıldıktan sonra bölgeleri gizle
- Mum sayısı etiketi: açık/kapalı, renk, yazı tipi boyutu
- Kenarlık rengi ve genişliği, tutulan maksimum bölge sayısı, yüklemede taranan grafik çubukları
Tipik kullanım
Kendi destek ve dirençlerinizde nesnel ikinci bir görüş olarak kullanın — bir seviye sadece mumlar tekrar tekrar önemli olduğunu kanıtladığı için görünür, grafikte önemli göründüğü için değil.
Temel zaman dilimini giriş grafiğinizden daha yüksek ayarlayarak, onları bulmak için pencere değiştirmeden temiz daha yüksek zaman dilimi raflarından işlem yapabilirsiniz. Ya da mevcut oturumun nerede reddedildiğini saf fiyat hareketi okumak için grafik zaman diliminizle eşleştirin.
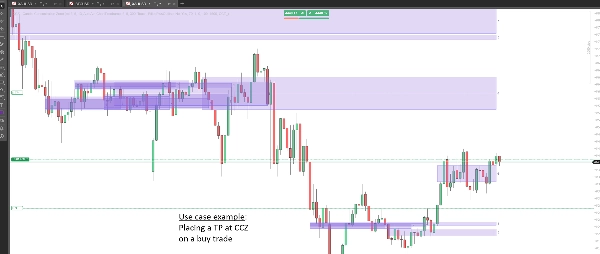
Bölgeleri ayrı bir giriş tetikleyicisi ile doğal olarak eşleştirin: dönüş veya kırılma aramak için eğiliminiz olarak bölgeleri kullanın ve ne zaman harekete geçeceğiniz için kendi sinyalinizi kullanın. Bazı durumlarda, hedef alan olarak da okuyabilirsiniz.
Kimler için
Zaten destek, direnç veya arz ve talep bölgeleri terimleriyle düşünen ve güçlü olanları gözle değil kural tabanlı bir şekilde bulmak isteyen traderlar için. Skalping zaman dilimlerinden swing trading'e, forex, endeksler, metaller veya kripto üzerinde faydalıdır. Zaten giriş kararlarınız için bir yönteme sahip olduğunuzu varsayar — bu araç seviyeleri bulur, tetikleyiciyi değil.
Yapmadıkları
- Alım veya satım sinyalleri, giriş, stop veya hedef fiyatları vermez
- Emir vermez ve hesabınıza dokunamaz — gösterge hiçbir erişim hakkı olmadan çalışır
- Uyarı veya bildirim yoktur
- Geçmişi yeniden boyamaz: sadece kapanmış mumlar sayılır ve bir bölgenin güç sayısı sonradan değişmez. Sağ kenarı her barda ileriye doğru uzamaya devam eder, ta ki bölge azaltılana kadar — bu bölgenin canlı kalmasıdır, geçmişin yeniden çizilmesi değil
Bilmeniz gerekenler
Temel zaman dilimini grafiğinizden daha yüksek ayarlarsanız, "ATR ölçümü"nü de temel zaman dilimine geçirin. Grafik zaman diliminde bırakmak, daha yüksek zaman dilimi mumunu daha küçük bir cetvelle ölçer, bu da fiyat bandını çok ince ve bölgeleri çok nadir yapar.
Bir bölge ancak fiyat önce bölgeden ayrılıp sonra geri döndükten sonra azaltılmış olarak değerlendirilebilir — hâlâ oluşan bir bölge kendi ilk mumunda azaltılamaz.
Daha yüksek zaman dilimi temel mumları brokerınızın sunucu zamanında başlar. İki broker aynı sembol için aynı yüksek zaman dilimi mumunu farklı noktalarda kesebilir, bu yüzden bölgeler brokerlar arasında biraz farklı okunabilir. Bu verinin bir özelliğidir, göstergenin hatası değildir.
Ticaret risk içerir. Geçmiş performans gelecekteki sonuçları garanti etmez.
Özet
Key features include:
- Detection of zones from any user-defined base timeframe, independent of the chart timeframe, allowing higher timeframe zones to be viewed on lower timeframe charts.
- Zones are displayed as rectangles with a strength score indicating the longest consecutive candle count overlapping the zone.
- Mitigation rules determine when a zone is considered tested and no longer extends forward, with options for strict or lenient definitions based on candle touches or closes.
- Customizable settings such as minimum candles in a row, scan depth, band height resolution, zone style, and label display.
- Designed for traders who use support, resistance, or supply and demand concepts and want an objective, rule-based method to identify strong levels.
- Supports markets including forex, indices, metals, and crypto across scalping to swing trading timeframes.
- The indicator does not provide trade signals, alerts, or order execution capabilities and does not repaint historical data.
CCZ serves as a tool to objectively highlight price consolidation zones that can be used as bias areas for potential reversals or breakouts.
Müşteri değerlendirmeleri
Tartışma
SSS
Bu oluşturanın diğer ürünleri





!["[Hamster-Coder] Moving Average MTF" logosu](https://cdn.ctrader.com/image/webp/b11b98b1-194d-4b8e-b00e-d611826ad159_31226)













Fiyat