


الوصف
ما الذي يفعله
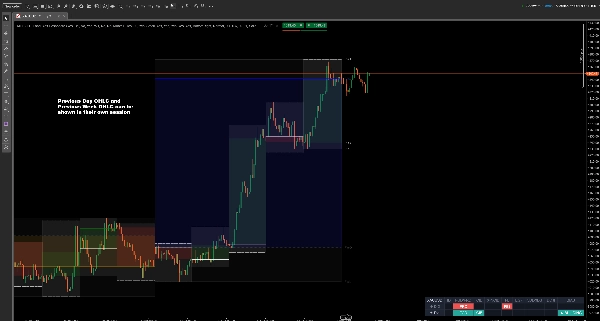
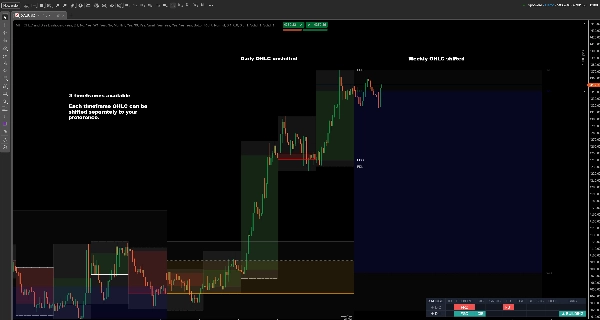
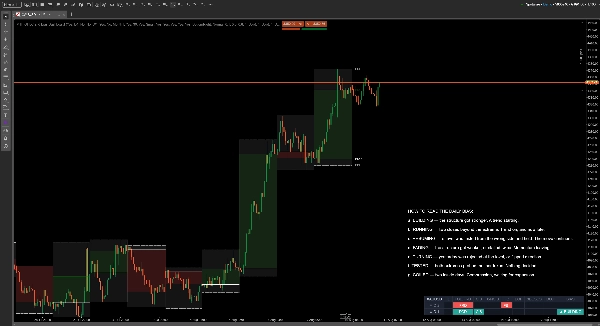
لوحة معلومات OHLC متعددة الأطر الزمنية والتحيز هي مؤشر حركة سعر متعدد الأطر الزمنية لـ cTrader. يرسم مستويات OHLC لليوم السابق، الأسبوع السابق والشهر السابق — الافتتاح، الأعلى، الأدنى والإغلاق — على الرسم البياني الخاص بك، ويضيف لوحة معلومات تقرأ ما فعله السعر فعليًا عند تلك المستويات خلال اليومين المكتملين الأخيرين.
أعلى وأدنى اليوم السابق (PDH و PDL)، الافتتاح اليومي، أعلى وأدنى الأسبوع: هذه هي مستويات الدعم والمقاومة للأطر الزمنية الأعلى التي يعمل منها معظم المتداولين اليوميين والمتأرجحين بالفعل. ما يفعلونه عادة بالعين كل صباح هو مقارنتها — هل أغلق الأمس فوق اليوم الذي قبله؟ هل اخترق السعر أعلى اليوم السابق وفشل؟ هل الحركة تتزايد أم تنفد المساحة؟ هذا المؤشر يجيب على تلك الأسئلة على الرسم البياني، في صف واحد.
مستويات OHLC متعددة الأطر الزمنية
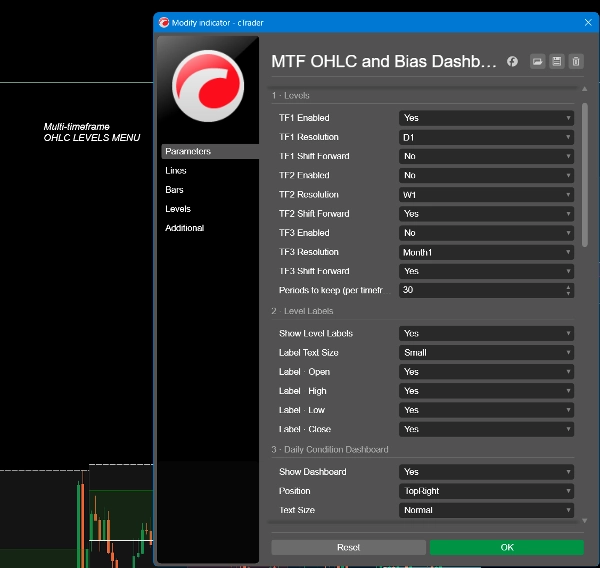
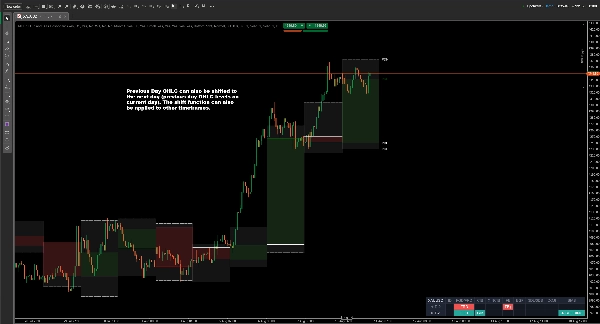
حتى ثلاث أطر زمنية في نفس الوقت — يومي، أسبوعي، شهري، أو أي دقة تختارها. كل منها يرسم الافتتاح، الأعلى، الأدنى والإغلاق، مع جسم مظلل اختياري وشريط من الأعلى إلى الأدنى. يمكن تحريك المستويات للأمام بحيث يكون مرجع الفترة الحالية أمام السعر بدلاً من خلفه، ويمكنك الاحتفاظ بما يصل إلى 70 فترة تاريخية على الرسم البياني.
كل خط له لونه وسمكه ونمطه الخاص، بحيث لا يتم الخلط بين مستوى دعم أسبوعي ومستوى يومي.
لوحة حالة اليومية
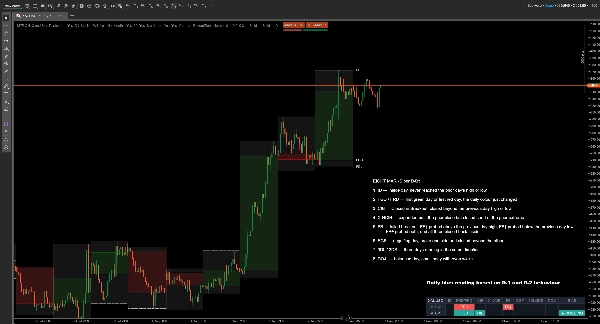
تقوم لوحة المعلومات بتقييم آخر شمعتين يوميتين مكتملتين — D-1 (أمس) و D-2 (اليوم الذي قبله) — كل منهما مقابل اليوم الذي سبقه.
تسع علامات لكل يوم:
- ID — يوم داخلي، لم يصل أبدًا إلى أعلى أو أدنى اليوم السابق
- FGD / FRD — أول يوم أخضر أو أول يوم أحمر، تغير لون اليوم فقط (الأخضر يوم صعودي والأحمر يوم هبوطي)
- CIB — أغلق في الاختراق، أغلق فوق أعلى أو أدنى اليوم السابق
- X-NCIB — توسع بعد الإغلاق السابق لكنه أغلق قبل الحد الأقصى السابق (توسع ولم يغلق في الاختراق = X-NCIB)
- FB — اختراق فاشل: FB↑ اختبر فوق أعلى اليوم السابق، FB↓ اختبر تحت أدنى اليوم السابق، FB± اختبر كلاهما، وأغلق الثلاثة داخل النطاق
- EGF — يوم ابتلاعي، كسر جانبًا وأغلق خلف الجانب الآخر
- 3DL / 3DS — ثلاثة أيام متتالية في نفس الاتجاه (3 أيام صعود = 3DL / 3 أيام هبوط = 3DS)
- DOJI — يوم متوازن، جسم صغير مع فتائل متساوية
- BIAS — القراءة، موضحة أدناه
كيفية قراءة التحيز اليومي
التحيز هو الجزء الذي يوفر عليك العمل. كل يوم ينهار إلى حالة واحدة، ويأتي التحيز من الحركة بين D-2 و D-1 — وليس من الأمس فقط. نفس العلامة تعني أشياء مختلفة اعتمادًا على ما سبقها، وهذا بالضبط ما لا يمكن أن تخبرك به لوحة معلومات يوم واحد.
- BUILDING — الهيكل أصبح أقوى. بداية اتجاه.
- RUNNING — إغلاقان يتجاوزان الحد الأقصى. الاتجاه مستمر، والآن متأخر.
- RESUMING — تم اختبار مستوى من الجانب الخطأ وتم الثبات عليه. الحركة تستمر.
- FADING — الهيكل أصبح أضعف، أو توقف مرتين. الزخم يتلاشى.
- TURNING — تم رفض الأمس عند المستوى، أو تغير الاتجاه.
- TESTED — تم اختبار كلا الحدين، ولم يتم أخذهما. لم يتم اتخاذ قرار.
- COILED — يومان داخليان. ضغط، انتظار للتوسع.
سهم ولون يحملان الاتجاه: أخضر للأعلى للصعودي، أحمر للأسفل للهبوطي، رمادي محايد عندما لا يوجد اتجاه لإعطائه.
تبقى صفوف التفاصيل مرئية فوق التحيز، بحيث يمكنك دائمًا رؤية سبب قراءته بالطريقة التي يفعلها بدلاً من الاعتماد على صندوق أسود.
الاستخدام النموذجي
افتح الرسم البياني في الصباح، اقرأ التحيز، واعرف قبل بدء الجلسة ما إذا كنت تبحث عن استمرار، تراجع، أو نطاق. ثم تداول إعداداتك الخاصة مقابل المستويات المرسومة — أعلى وأدنى اليوم السابق، الافتتاح اليومي، الحدود الأسبوعية.
يناسب العمل على نطاق الافتتاح، تداول الاختراق الفاشل، واستراتيجيات الاستمرار اليومية. مفيد عبر الفوركس، المؤشرات، المعادن والعملات المشفرة.
الإعدادات
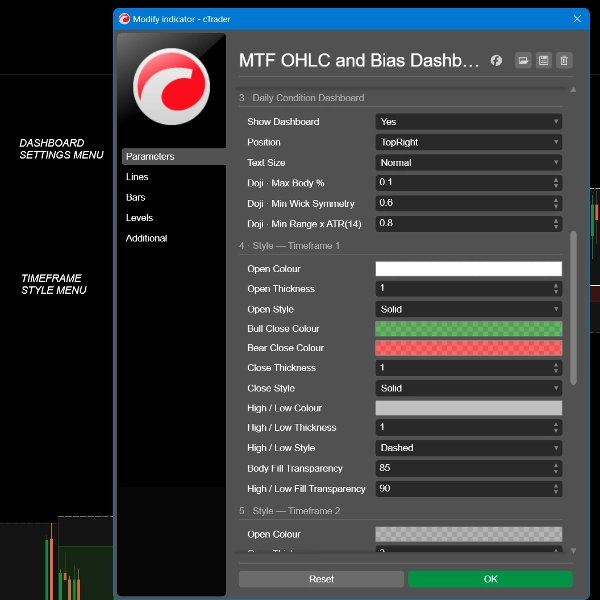
- ثلاث فتحات أطر زمنية مستقلة، كل منها بدقة خاصة به، مفتاح تحريك للأمام، وتحكم كامل في اللون، السمك والنمط
- عدد الفترات التاريخية للاحتفاظ بها، حتى 70
- تسميات المستويات تشغيل أو إيقاف، لكل نوع خط، مع حجم نص قابل للتعديل
- لوحة المعلومات تشغيل أو إيقاف، خمس مواقع على الشاشة، أربعة أحجام نص
- حساسية الدوجي: أقصى نسبة للجسم، أدنى تماثل للفتيل، أدنى نطاق نسبة إلى المتوسط 14 يومًا
******************************************************
لمن هو
المتداولون اليوميون والمتأرجحون الذين يعملون بالفعل من مستويات اليوم السابق والأسبوع السابق. يفترض أنك تعرف ما هو أعلى اليوم السابق ولماذا هو مهم. إذا لم تكن تلك المستويات جزءًا من طريقة تداولك بالفعل، فلن يعلمك هذا كيفية استخدامها.
ما لا يفعله
كوننا واضحين بشأن هذا الآن يوفر علينا الوقت لاحقًا:
- لا يعطي إشارات شراء أو بيع، ولا أسعار دخول أو خروج
- لا يضع أوامر ولا يمكنه الوصول إلى حسابك — المؤشر يعمل بدون أي صلاحيات وصول
- لا يحتوي على تنبيهات أو إشعارات
- لا يتنبأ بشيء. كل علامة تصف شموعًا أغلقت بالفعل
- لا يعيد الرسم. لوحة المعلومات تقرأ فقط الشموع اليومية المكتملة، لذا لا تتغير القراءة بعد الحدث
- ليس استراتيجية. التحيز يصف الهيكل؛ لا يوصي بتداول
********************************************************
أشياء تستحق المعرفة
تحتاج لوحة المعلومات إلى ما لا يقل عن أربع شموع يومية مكتملة، لذا سيظهر رمز جديد مدرج شرطات حتى يكون لديه تاريخ كافٍ.
تبدأ الشموع اليومية في وقت خادم الوسيط الخاص بك. يمكن لوسيطين على نفس الأداة أن يقطعوا اليوم في ساعات مختلفة، مما يعني أن نفس الرمز يمكن أن يقرأ بشكل مختلف بشكل مشروع على منصتين. هذه خاصية في البيانات، وليست خطأ في المؤشر.
فوق الإطار الزمني اليومي، لا يمكن للوحة المعلومات قراءة بيانات يومية وتظهر تحذير TF > D. لا تزال المستويات ترسم.
التداول ينطوي على مخاطر. الأداء السابق لا يضمن النتائج المستقبلية.
الملخص
A central feature is the two-day price action bias dashboard, which analyzes the last two completed daily candles relative to their preceding days. It categorizes daily price behavior into nine distinct patterns (e.g., inside day, first green/red day, failed breakout, engulfing day) and summarizes the overall bias into states such as building, running, fading, or turning. Directional bias is indicated with colored arrows (green for bullish, red for bearish, grey for neutral), helping traders quickly assess market structure without guesswork.
Designed for intraday and swing traders familiar with previous day and week levels, the indicator does not provide trade signals, alerts, or order execution. It is suitable for forex, indices, metals, and cryptocurrencies, aiding strategies like opening-range, failed-breakout, and continuation trading by clearly marking key levels and daily price action context.
مناقشة
تقييمات العملاء
الأسئلة الشائعة
المزيد من هذا المؤلف







![شعار "[Stellar Strategies] VBO"](https://cdn.ctrader.com/image/webp/f034c012-94d4-445a-a01b-febd1cdedaef_36944)












السعر