

PnL Calendar Plus
Masaüstü eklentisi
Sürüm 1.0, Sep 2026
Windows, Mac

Başlangıç 27/02/2026
33.16K
İşlem hacmi
25.96K
Kazanılan pip
10
Satışlar
505
Ücretsiz yüklemeler
Açıklama
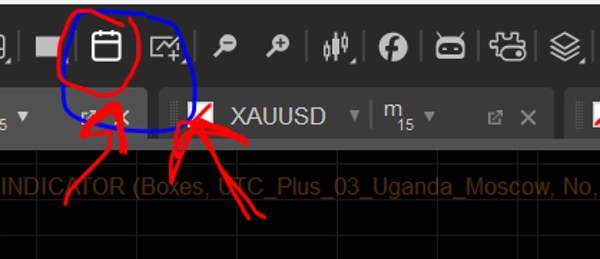
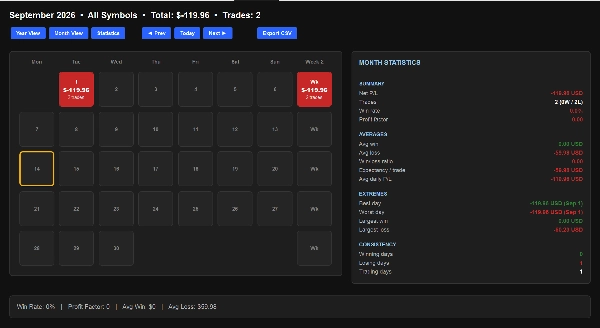
📅 PnL Takvim Görünümü
- Aylık ve Yıllık Isı Haritaları: Renk kodlu kar (yeşil) ve zarar (kırmızı) kutucuklarla günlük ve aylık kazanç veya kayıpları görün.
- Haftalık Özetler: Her satırın sonunda haftalık toplam PnL ve işlem sayılarını takip eder.
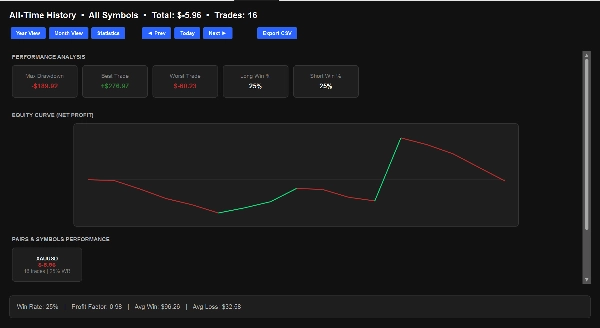
📊 Kapsamlı İstatistik Paneli
- Performans Ölçütleri: Toplam kar faktörünüzü, genel kazanma oranınızı, ortalama kazanç/kayıp miktarlarını ve maksimum düşüşü görün.
- Öz Sermaye Eğrisi Grafiği: Zaman içinde genel net kar ilerlemenizi gösteren görsel grafik.
- Sembol Dağılımı: Belirli döviz çiftleri veya enstrümanlara göre performans, kazanma oranları ve toplam işlemleri görün.
- Zaman Analizi: En karlı işlem günlerinizi ve en iyi performans gösteren aylarınızı otomatik olarak belirler.
🔒 Güvenli ve Hafif
- Özel İzin Yok: Standart erişim haklarıyla çalışır (
AccessRights.None), bu da onu tamamen güvenli ve cTrader'a yüklemesi kolay yapar.
Özet
YZ özeti
PnL Calendar Plus is a cTrader plugin designed to visualize and analyze trading performance through a calendar-based interface and detailed statistics. It features monthly and yearly heatmaps that display daily and monthly profits or losses using color-coded tiles (green for profit, red for loss). Weekly summaries provide total profit and loss (PnL) and trade counts for each week.
The plugin includes a comprehensive statistics dashboard offering key performance metrics such as total profit factor, overall win rate, average win and loss amounts, and maximum drawdown. An equity curve chart tracks net profit progression over time. Users can view a symbol breakdown showing performance, win rates, and trade counts by specific currency pairs or instruments. Time analysis automatically identifies the most profitable trading days and months.
PnL Calendar Plus operates with standard access rights, requiring no special permissions, ensuring safe and lightweight integration within the cTrader platform. It supports historical data analysis and is categorized under trade journaling and chart UI tools.
The plugin includes a comprehensive statistics dashboard offering key performance metrics such as total profit factor, overall win rate, average win and loss amounts, and maximum drawdown. An equity curve chart tracks net profit progression over time. Users can view a symbol breakdown showing performance, win rates, and trade counts by specific currency pairs or instruments. Time analysis automatically identifies the most profitable trading days and months.
PnL Calendar Plus operates with standard access rights, requiring no special permissions, ensuring safe and lightweight integration within the cTrader platform. It supports historical data analysis and is categorized under trade journaling and chart UI tools.
Eklenti profili
Eklenti kategorisi
Günlük
Veri erişimi
Geçmiş
Müşteri değerlendirmeleri
0.0
Değerlendirmeler: 0
Müşteri değerlendirmeleri
Bu ürün için henüz bir değerlendirme yok. Ürünü denediniz mi? O zaman ona dair görüşlerini paylaşan ilk kişi olun!
Tartışma
SSS
AI Integration
Chart UI Tools
Trade Journal
cTrader Store üzerinden erişilebilen işlem botları, göstergeler ve eklentiler gibi ürünler, üçüncü taraf sağlayıcılar tarafından sağlanır ve yalnızca bilgilendirme ve teknik erişim amaçlarıyla sunulur. cTrader Store bir broker değildir ve yatırım tavsiyesi, kişisel öneriler vermez veya gelecekteki performansı garanti etmez.
Bu oluşturanın diğer ürünleri









Fiyat
Başlangıç 27/02/2026
33.16K
İşlem hacmi
25.96K
Kazanılan pip
10
Satışlar
505
Ücretsiz yüklemeler