present
Regístrese y obtenga 50 $ de descuento en su primera compra
Trading product for Break Tracer Indicador EMA SMA, image 1
Break Tracer
Indicador
Versión 1.0, Sep 2026
Windows, Mac
Trading product for Break Tracer Indicador EMA SMA, image 2
Trading product for Break Tracer Indicador EMA SMA, image 3
Trading product for Break Tracer Indicador EMA SMA, image 4
Trading product for Break Tracer Indicador EMA SMA, image 5
Trading product for Break Tracer Indicador EMA SMA, image 6
Trading product for Break Tracer Indicador EMA SMA, image 7
Trading product for Break Tracer Indicador EMA SMA, image 8
Trading product for Break Tracer Indicador EMA SMA, image 9
Trading product for Break Tracer Indicador EMA SMA, image 10
Trading product for Break Tracer Indicador EMA SMA, image 11
3
Ventas
15
Instalaciones gratis

Descripción

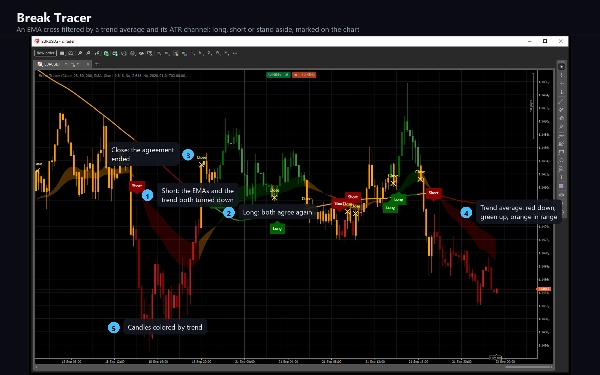
Break Tracer reads the trend in two layers and only acts when they agree.


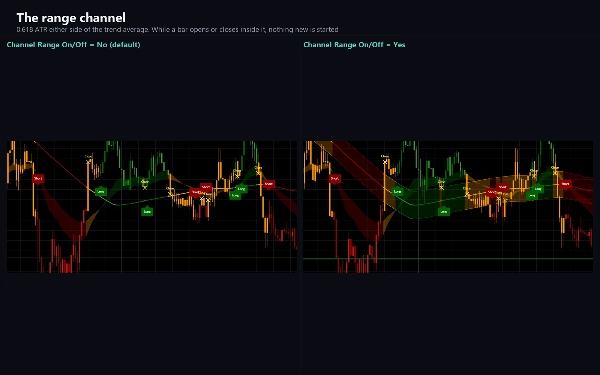
A fast pair of exponential moving averages (26 and 50) gives the short-term direction. A 200-bar trend average, with a channel of 0.618 times the average true range around it, gives the trend. When the fast pair points up and price is above the trend average, the trend is up; when both point down, it is down; and while a bar opens or closes inside the channel, the market is treated as ranging and nothing new is started.


WHAT YOU SEE


A trend line in green or red shades, orange while the market is ranging.

A shaded band between the two fast averages, in the same colours.

A Long plate under the bar where an up-trend begins and a Short plate over the bar where a down-trend begins.

A yellow cross where a position is closed because the trend or the fast averages turned.

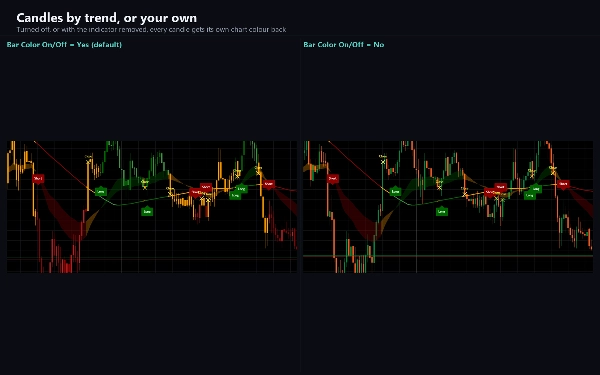
Candles colored by trend, with a lighter shade for a candle that closes against it.

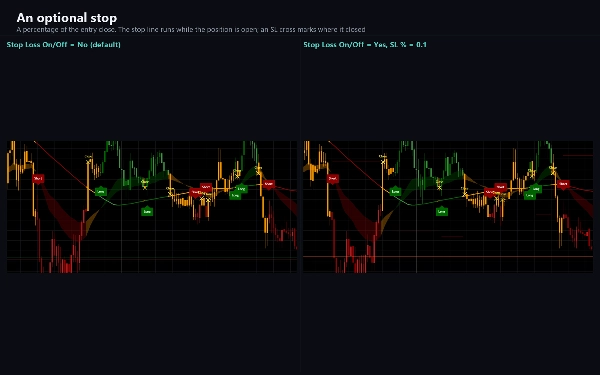
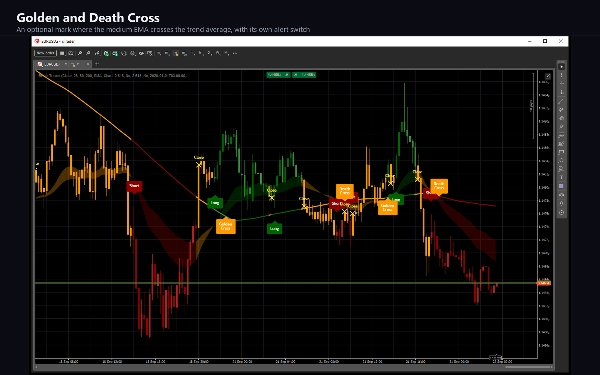
Optional: the channel itself, a stop line with an SL cross at the level that closed the position, Golden Cross and Death Cross plates where the medium average crosses the trend average, and a gray shading outside a date window of your choosing.


HOW TO USE IT


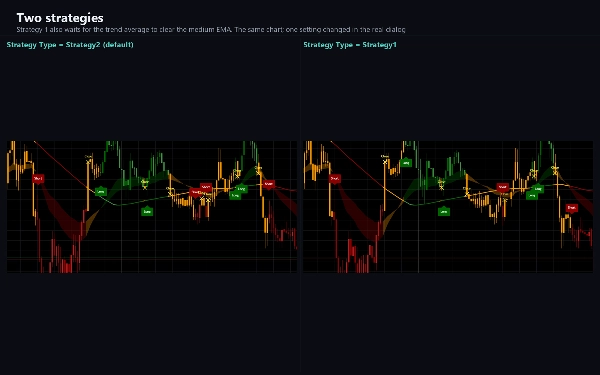
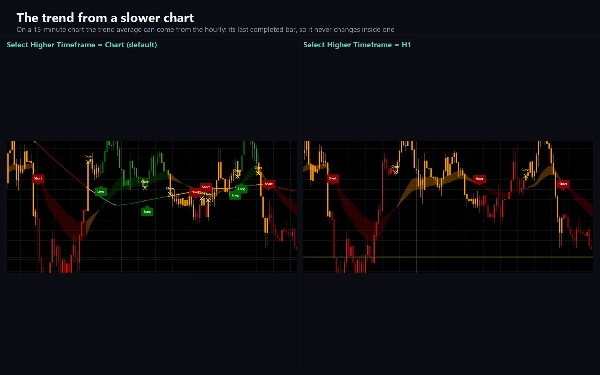
A Long or Short plate marks the moment both layers agree; the close cross marks the moment they stop agreeing. Strategy 2, the default, takes every agreement; Strategy 1 is stricter and stands aside while the trend average is still on the wrong side of the medium average. Long only, short only or both can be chosen. The trend average can be taken from a higher timeframe - for example the hourly on a five-minute chart - and it then uses the last completed higher-timeframe bar, so it never changes within that bar.


SETTINGS


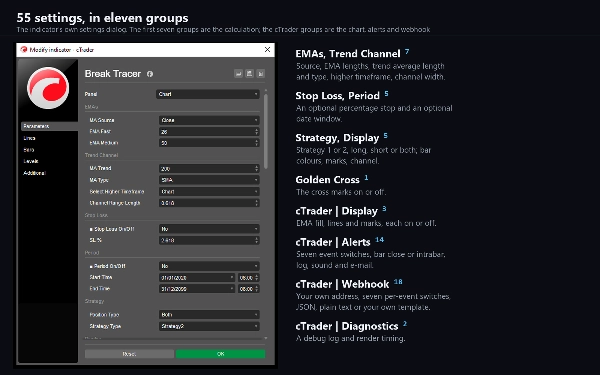
Source, EMA lengths, trend average length and type (SMA or EMA), the higher timeframe, the channel width, an optional percentage stop, an optional date window, the strategy type and which sides to take. Each drawing element has its own switch, and switching one off changes the drawing only: the values, alerts and webhook carry on.


ALERTS AND WEBHOOK


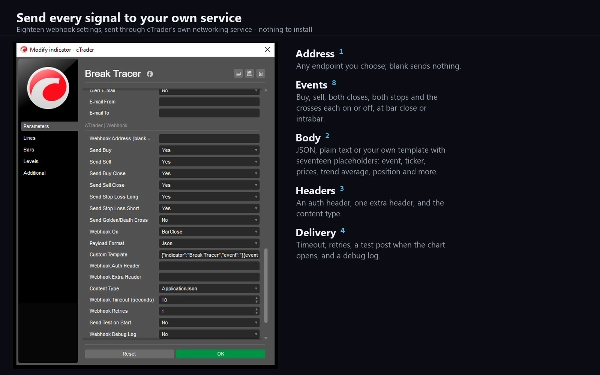
Six events: Buy, Sell, Buy Close, Sell Close, Stop Loss Long and Stop Loss Short, plus Golden and Death Cross as an option. Each has its own switch and can fire when the bar closes or as soon as the condition is met. Delivery is a log line, a sound or an e-mail. There is also a webhook: enter an address and each event is posted to it as JSON, as plain text, or in a template you write yourself with placeholders for the symbol, timeframe, time, prices, the averages, the trend state and the position. It stays off until you enter one, it sends nothing during the history pass or in a backtest, and it needs no special access rights - posts go out through cTrader's own networking service.


FOR cBOTS


The trend average, both fast averages, the trend state and the position state are published as output series.


TYPE AND WINDOW


A trend indicator, drawn on the price chart.


TIMEFRAMES AND INSTRUMENTS


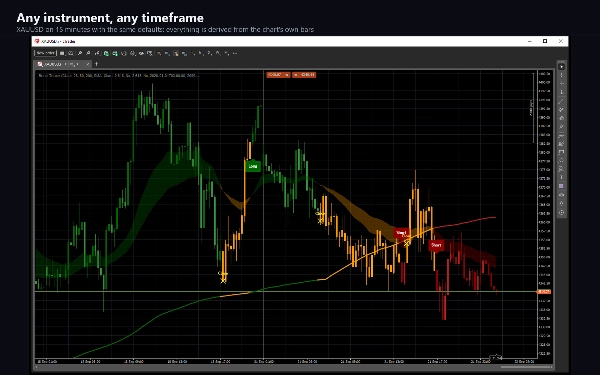
Any time-based timeframe; the defaults read well from M5 to H4, and the higher timeframe option lets a low timeframe chart follow a slower trend. It works on any instrument - forex pairs, metals, indices and crypto - because everything it uses is derived from the bars themselves.


WHO IT IS FOR


Traders who want a trend filter they can see: when to be long, when to be short, when to stand aside, and an alert at each change.


NOTES


The marks follow the bar that is still forming, so one can appear and disappear until that bar closes. Alerts and webhook posts default to bar close, where the condition is final. On a fresh chart the first mark is a Short on the second bar, because nothing can be measured until the averages exist.


Trading involves risk. Past performance does not guarantee future results.

Resumen

Resumen de IA
Break Tracer is a trend indicator designed for use on price charts across any time-based timeframe, suitable for instruments including forex pairs, metals, indices, and cryptocurrencies. It combines two layers of trend analysis: a fast pair of exponential moving averages (EMAs) with periods 26 and 50 to capture short-term direction, and a slower 200-bar trend average (SMA or EMA) surrounded by an ATR-based channel (0.618 times the average true range) to define the overall trend. The indicator signals a trend only when both layers agree—uptrend when fast EMAs point up and price is above the trend average, downtrend when both point down, and a ranging market when price bars fall inside the ATR channel.

Visual elements include a color-coded trend line (green/red for trend, orange for range), shaded bands between fast EMAs, Long and Short plates marking trend starts, yellow crosses indicating position closes, and candles colored by trend strength. Optional features include the ATR channel display, stop lines with stop-loss crosses, Golden and Death Cross plates, and customizable date window shading.

Break Tracer supports configurable strategies for trade entries and exits, higher timeframe trend averaging, and selective long/short signals. It provides six alert events (Buy, Sell, Close, Stop Loss, Golden/Death Cross) with customizable delivery via log, sound, email, or webhook posting JSON or templated messages. Output series for cBots include trend averages and position states. Settings allow adjustment of sources, lengths, channel width, stop percentages, and visual elements independently.
Perfil del indicador
Categoría del indicador
Tendencia
Tipo de resultado
Visualización
Señales
Requisitos de datos
Únicamente barras
Señales admitidas
Cruce
Ruptura de nivel

Valoraciones de clientes

0.0
Valoraciones: 0
Valoraciones de clientes
Este producto todavía no se ha valorado. ¿Ya lo ha probado? Sea el primero en informar a otros.

Conversación

Preguntas frecuentes

EMA
SMA
Channel
ATR
Moving Average
Los productos disponibles a través de cTrader Store, incluidos bots, indicadores y plugins para operar, son proporcionados por desarrolladores de terceros y están disponibles únicamente con fines informativos y de acceso técnico. cTrader Store no es un bróker, por lo que no proporciona asesoramiento de inversión, recomendaciones personales ni ninguna garantía de rentabilidad futura.

Más de este autor

Indicador
ATR
CCI
+4
A trend line that never steps back, a shaded band to the price, and a pointer at the swing where the trend turns.
Indicador
ATR
RSI
+4
RSI bands drawn on price, confluence-scored BUY/SELL signals, an ATR stop with three targets
Indicador
ATR
RSI
+5
Fusion trend line with a layered cloud, BULL and BEAR labels, scored re-entry triangles and exit markers.
Indicador
ADX
ATR
+5
SuperTrend signals scored on five confluence factors, with an ATR stop, three targets and a dashboard.
Indicador
ADX
ATR
+5
Ten confluence layers scored on every closed bar, with an anti-chop gate, pivot levels and a live dashboard.
Indicador
Volume
Key Levels
+1
Fixed-grid volume profile: bull and bear volume at every price level, with Point of Control and value area.
Indicador
ATR
RSI
+4
Adaptive Ichimoku with nine-factor confluence scoring, five signal types, smart TP/SL and an MTF panel.
Indicador
ATR
EMA
+3
EMA trend, RSI reclaim and divergence signals with ATR stop and two targets, swing levels and a 16-row dashboard.
Indicador
ATR
EMA
+2
Eight-EMA ribbon with ATR trade zones, a nine-symbol screener and a five-timeframe trend dashboard.
Indicador
Key Levels
Order Block
+5
Order blocks, fair value gaps, liquidity sweeps and a 24-timeframe signal scanner on one chart.
Indicador
ADX
ATR
+5
EMA-cross signals scored on six confluence layers, with an ATR stop, three targets and a live panel
Indicador
ADX
ATR
+5
Range-filter BUY/SELL flips with an ATR or swing stop, three targets, five confluence stars and a live panel

Puede interesarle

Indicador
ATR
RSI
+6
📊Predicts price movement by combining multi-timeframe trend analysis, market volatility 📉, and..
Indicador
ADX
ATR
+5
Signal Quality Score - 0-100 filter combining RSI, Volume, ATR, Trend Strength & Alignment. Works on ANY chart type.
Indicador
ADX
ATR
+5
Identifies TRENDING, RANGING and VOLATILE markets with pullback detection. Anti-noise filter. Works on ANY chart.
Indicador
Forex
Crypto
+3
Consecutive Series Moves — Reveal the True Pulse of Price Action
Indicador
ATR
Forex
+5
Most used candle patterns. (1 candle, 2 candles and 3 candles patterns) and Marubozu. Bonus Fibo Risk control.
Indicador
PVA Volume Analysis Indicator:Price volume over trend strength and direction
Indicador
Key Levels
Order Block
+5
Order blocks, fair value gaps, liquidity sweeps and a 24-timeframe signal scanner on one chart.
Indicador
BOS
Fibonacci
+4
Automatically draws major trading sessions, killzones, and SMC daily liquidity targets directly on your cTrader charts.
Indicador
Prop
Forex
+12
Identify and trade breakouts with Consolidation Zones! Visualize price consolidation areas for trading opportunities.
Indicador
Key Levels
Liquidity Sweep
+2
Complete intraday market structure tool tracking session killzones, Asian range projections, and PDH/PDL levels.
Indicador
Grid
Prop
+16
Those who are involved in trading know how important it is to take into account the previous session. With Order Block
Indicador
Brooks price action breakout mode patterns
Indicador
ATR
EMA
+4
Range-filter BUY/SELL signals scored by four confluence layers, with a stop, five targets and a trend panel
Indicador
Prop
Forex
+12
Introducing High Accuracy multi timeframe Swing high and low detector.
Indicador
Forex
BTCUSD
+4
The Linear Regression Oscillator (LRO) is a technical indicator based on linear regression analysis.
Indicador
ATR
Forex
+1
Trade fearlessly: auto-adjusts order blocks, manages risks, and ensures precision. Free for early users.
Indicador
The Weekly Daily Levels indicator shows the OHLC, and mid-point prices for the previous day and week.
Indicador
ADX
ATR
+5
Ten confluence layers scored on every closed bar, with an anti-chop gate, pivot levels and a live dashboard.

Precio

3
Ventas
15
Instalaciones gratis