present
가입하고 첫 구매 시 $50 할인을 받으세요
Trading product for Reverse RSI Phantom 지표 Supertrend Key Levels, image 1
Reverse RSI Phantom
지표
1 구매
버전 1.2, Sep 2026
Windows, Mac
5.0
리뷰: 1
Trading product for Reverse RSI Phantom 지표 Supertrend Key Levels, image 2
Trading product for Reverse RSI Phantom 지표 Supertrend Key Levels, image 3
Trading product for Reverse RSI Phantom 지표 Supertrend Key Levels, image 4
Trading product for Reverse RSI Phantom 지표 Supertrend Key Levels, image 5
Trading product for Reverse RSI Phantom 지표 Supertrend Key Levels, image 6
Trading product for Reverse RSI Phantom 지표 Supertrend Key Levels, image 7
Trading product for Reverse RSI Phantom 지표 Supertrend Key Levels, image 8
Trading product for Reverse RSI Phantom 지표 Supertrend Key Levels, image 9
Trading product for Reverse RSI Phantom 지표 Supertrend Key Levels, image 10
Trading product for Reverse RSI Phantom 지표 Supertrend Key Levels, image 11
8
판매
164
무료 설치

설명

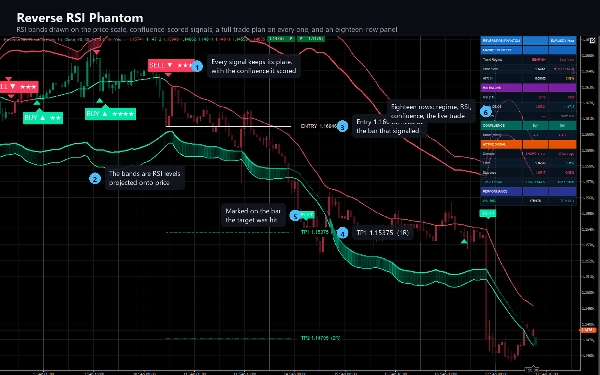
리버스 RSI 팬텀은 RSI를 뒤집습니다. 오실레이터를 차트 아래의 창에 그리는 대신

RSI 공식을 역으로 풀어 다른 질문을 던집니다: RSI를 정확히 70으로 만드는 가격은 무엇이며, 30으로 만드는 가격은 무엇인가? 이 두 가격은

밴드로 차트에 그려지며, 각 바마다 움직입니다.

이 한 가지 변화로 전체 오실레이터가 가격 축에 놓여, 캔들, 당신의 레벨, 그리고 인디케이터가 그려주는 계획과 함께 볼 수 있습니다.

그림 내용

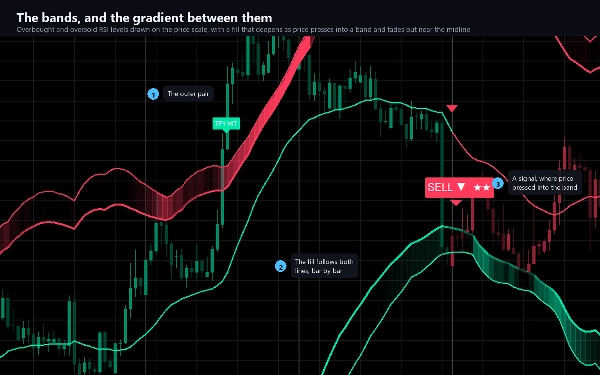
- 당신이 선택한 과매수 및 과매도 레벨에서 두 밴드와 그 외곽선이 가격에 투영되어 그려지며 선택적으로 스무딩됩니다.

- 각 밴드 내부에 가격이 밴드에 밀착할수록 짙어지고 중간선 근처에서는 완전히 희미해지는 그라데이션 채우기가 있어, 차트가 숫자 하나 없이 압력을 알려줍니다.

- 추세 체계 색상을 가진 중간선.

- 같은 체계 색상으로 색칠된 캔들로 방향을 한눈에 읽을 수 있습니다.

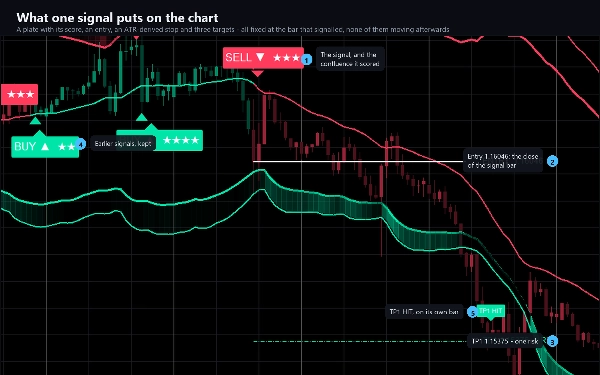
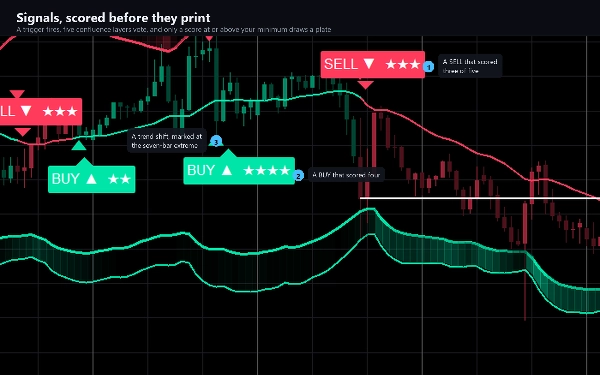
- 신호 바마다 BUY 또는 SELL 플레이트가 있으며, 다섯 점 만점의 합류 점수를 표시합니다.

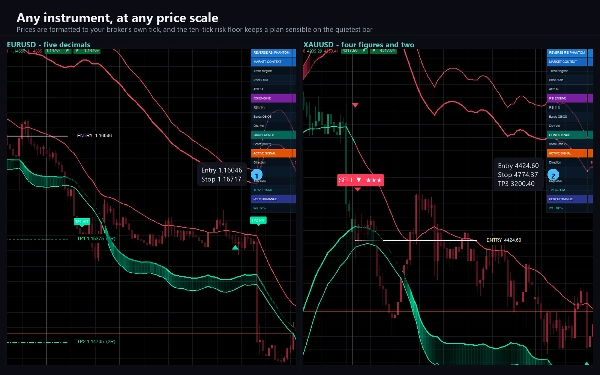
- 신호 바에 완전한 거래 계획: 진입, ATR에서 파생된 스톱, 그리고 설정한 위험 배수에 따른 세 개의 목표. 다섯 개의 선과 다섯 개의 가격 태그가 모두 신호를 준 바에 고정됩니다.

- 각 목표에 도달한 바와 스톱에 닿은 바에 플레이트가 표시됩니다.

- 추세 체계가 전환되는 지점에 삼각형, RSI가 가격과 다이버전스하는 지점에 표시가 있습니다.

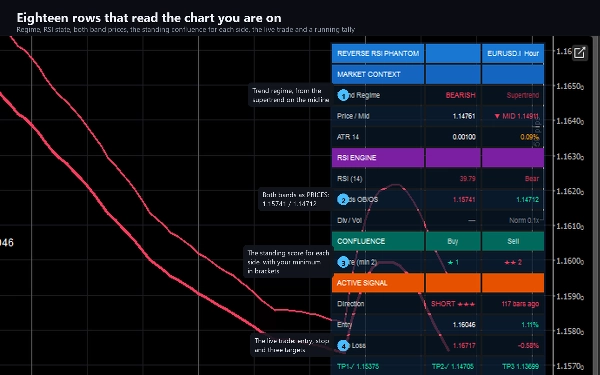
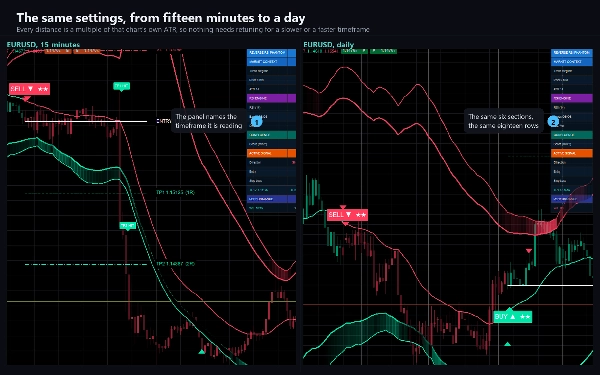
- 18행 패널: 체계, 중간선 대비 가격, ATR, RSI 및 상태, 두 밴드 가격, 다이버전스, 거래량, 각 측면의 현재 합류, 진입, 스톱, 세 목표가 있는 실시간 거래, 그리고 차트 역사에서 일어난 일의 누적 기록.

결정 방식

신호는 단일 조건이 아닙니다. 트리거가 작동합니다 - 체계 전환, 가격이 밴드를 교차하거나 다이버전스가 확인될 때 - 그리고 다섯 개의 합류 레이어가 투표합니다: 체계, RSI 확인, 밴드 재테스트, 다이버전스, 거래량 확인. 점수는 0에서 5까지이며, 플레이트에 별로 표시되고, 설정한 최소 점수에 도달해야만 그려집니다. 추세 게이트와 방향별 쿨다운이 남은 것을 필터링하며, 양쪽 모두 같은 바에서 자격을 갖추면 더 높은 점수가 선택됩니다.

기본적으로 Non-Repaint 모드가 켜져 있습니다: 바가 닫힌 후에만 판단하므로, 출력된 플레이트는 움직이지 않고 사라지지 않습니다.

주요 설정

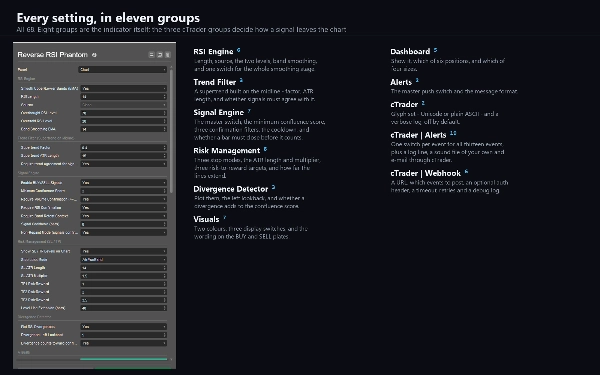
11개 그룹에 68개 설정: RSI 길이, 소스 및 두 레벨; 밴드 스무딩; 슈퍼트렌드 필터의 계수와 ATR 길이; 최소 합류 점수 및 세 개의 확인 필터; 신호 쿨다운; ATR 길이와 배수가 있는 세 가지 스톱 모드; 세 개의 위험 대비 보상 목표; 다이버전스 되돌아보기; 두 가지 색상과 플레이트의 문구; 패널 위치와 크기; 그리고 알림과 웹훅을 위한 cTrader 전용 세 그룹.

알림 및 웹훅

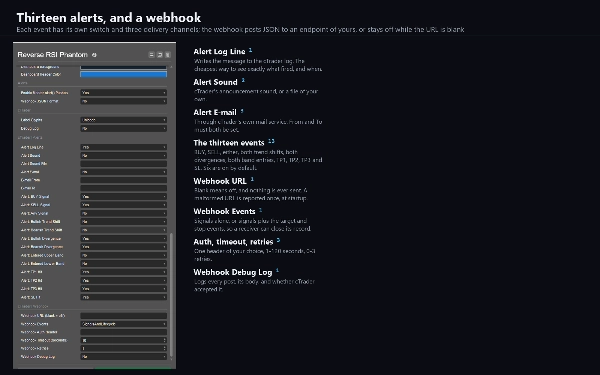
13개의 이벤트 각각에 스위치가 있습니다: BUY, SELL, 어느 쪽이든, 양쪽 추세 전환, 양쪽 다이버전스, 양쪽 밴드 진입, 세 개 목표 모두 및 스톱. cTrader 로그 라인, 선택한 소리, 이메일로 전달됩니다. 인디케이터가 차트 역사를 걷는 동안이나 백테스트에서는 아무것도 작동하지 않습니다.

웹훅은 동일한 이벤트를 JSON 형식으로 원하는 주소(트레이딩 봇, 저널, 릴레이, 자동화 흐름 등)에 전송합니다. 입력하지 않으면 꺼져 있으며, 이벤트별 바별 중복 제거, 분당 20개 메시지 제한, 실패 시 로그 기록만 하며 예외를 발생시키지 않습니다. cTrader 자체 네트워킹 서비스를 통해 전송되므로 인디케이터는 파일이나 네트워크 접근 권한이 전혀 필요 없습니다.

유형 및 창

오버레이 인디케이터: 모든 것이 가격 차트 위에 그려지며 별도의 창을 추가하지 않습니다.

타임프레임 및 상품

모든 타임프레임. 그 차트의 ATR 배수로 모든 거리를 그리며, 가격은 브로커의 틱 단위로 포맷되어 15분 차트와 일간 차트, 또는 소수점 다섯 자리 FX 페어와 네 자리 금 사이에 재조정이 필요 없습니다. 대부분의 테스트는 M15에서 H4 범위에서 수행되었습니다.

거래량이 필요합니다: 다섯 개 합류 레이어 중 하나가 이를 읽습니다.

사용 사례

- 과매수 및 과매도 압력을 가격 축에서 읽기.

- 추세 체계를 필터로 사용하여 밴드에서 평균 회귀 진입하기.

- 신호를 계획으로 전환: 하나의 스톱과 세 개의 목표를 행동 전에 그리기.

- 한 차트를 보면서 로그 라인, 소리, 이메일 또는 웹훅으로 무언가 발생할 때 알림 받기.

대상 사용자

이미 RSI를 사용하고 눈이 가는 곳에 RSI를 두고 싶은 트레이더, 그리고 신호가 화살표 대신 스톱과 목표 세트와 함께 오길 원하는 모든 사람.

체험판

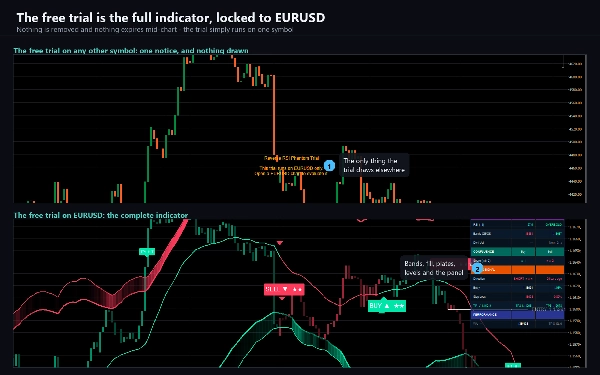
무료 체험판은 EURUSD에만 전체 인디케이터를 제공합니다 - 모든 브로커 접미사가 작동합니다. 다른 심볼에서는 알림을 표시하고 아무것도 그리지 않습니다. 시간 제한, 축소된 기록, 누락된 기능이 없습니다. 전체 버전은 심볼 제한을 제거하며 다른 것은 변경하지 않습니다.

기술적 참고 및 제한 사항

접근 권한: 없음. 인디케이터는 파일을 읽거나 프로세스를 시작하거나 자체적으로 연결을 열 수 없습니다.

차트 및 분석 도구입니다. 주문을 실행하지 않으며 계정에 접근 권한이 없습니다.

패널의 PERFORMANCE 행은 현재 설정 하에서 차트에 로드된 바에서 일어난 일을 집계합니다. 이는 역사에 대한 설명이지 백테스트나 예측이 아닙니다.

확인 필터를 끄면 합류 점수가 낮아지는 대신 높아집니다 - 다섯 레이어 중 세 개가 필터가 비활성화되면 점수를 부여합니다. 필터를 끌 경우 최소 점수를 맞게 올리십시오.

지원

질문은 Discussion 탭을 통해 문의하세요. 브로커, 심볼, 타임프레임, cTrader 버전과 스크린샷을 포함하면 첫 번째 문의에 유용한 답변을 받을 수 있습니다.

거래에는 위험이 따릅니다. 과거 성과가 미래 결과를 보장하지 않습니다.

요약

AI 요약
Reverse RSI Phantom is a trading indicator that reinterprets the traditional Relative Strength Index (RSI) by projecting RSI overbought and oversold levels directly onto the price chart as dynamic bands. Instead of displaying RSI in a separate pane, it calculates the price levels that correspond to RSI values of 70 and 30 and draws these as smoothed bands on the price scale, allowing traders to visually assess overbought and oversold pressure in context with price action.

Key features include:
- Two price bands representing RSI thresholds with gradient fills indicating pressure intensity.
- A midline and candle tinting reflecting the current trend regime.
- Confluence-scored BUY and SELL signals displayed on signal bars with a score out of five.
- A comprehensive trade plan per signal, showing entry, an ATR-based stop loss, and three customizable profit targets.
- Visual markers for trend regime changes and RSI-price divergences.
- An 18-row informational panel summarizing regime, ATR, RSI states, volume, confluence, active trades, and historical performance.
- Configurable settings covering RSI parameters, smoothing, trend filters, confluence thresholds, stop modes, risk targets, divergence lookback, and alert/webhook options.

The indicator operates as an overlay on any instrument and timeframe, requiring volume data for full functionality. Alerts and webhooks can notify users of key events such as signals, trend shifts, targets, and stops. Non-repaint mode ensures signals are fixed once bars close. It is designed for traders who use RSI and seek integrated signals with trade management guidance.
지표 프로필
지표 카테고리
모멘텀
출력 유형
시각화
신호
데이터 요구 사항
거래량
지원되는 신호
반전
다이버전스
레벨 터치
레벨 돌파
추세 강도

고객 리뷰

5.0
리뷰: 1
5
100 %
4
0 %
3
0 %
2
0 %
1
0 %
고객 리뷰
September 20, 2026
Intersting settings, configurative, bands act like bollinger on the exterior, while showing accurate signals for buy/sell in the OB/OS area (your choice). These new style indicators showcase coding expertise. You just simply have more options to ustilize than in most RSI indicators. ,Aswell, tlhe colorng is very rich, many tweaks can be made; no way to miss your entries with this one. Good job sir; thanks for support & professioanlism (others could definitely take a lesson from you).

상담

자주 묻는 질문(FAQ)

Supertrend
Key Levels
RSI
Volume
ATR
Support & Resistance
트레이딩 봇, 지표, 플러그인 등 cTrader Store에서 제공되는 상품은 제3자 개발자에 의해 제공되며, 이는 단순히 정보 및 기술적 접근을 목적으로 제공된 것입니다. cTrader Store는 중개인이 아니며, 투자 조언, 개인별 추천 또는 향후 성과에 대한 어떠한 보장도 제공하지 않습니다.

이 작성자의 상품 더 보기

지표
ATR
CCI
+4
A trend line that never steps back, a shaded band to the price, and a pointer at the swing where the trend turns.
지표
ATR
RSI
+4
Adaptive Ichimoku with nine-factor confluence scoring, five signal types, smart TP/SL and an MTF panel.
지표
ATR
RSI
+5
Fusion trend line with a layered cloud, BULL and BEAR labels, scored re-entry triangles and exit markers.
지표
ADX
ATR
+5
EMA-cross signals scored on six confluence layers, with an ATR stop, three targets and a live panel
지표
ATR
EMA
+3
EMA cross filtered by a trend average and its ATR channel, with long, short and close marks and colored candles.
지표
ATR
Volume
+3
Fibonacci trend signals on closed bars, with an ATR stop, up to four targets and a break-even ladder.
cBot
Balanced
Fixed Lot
+5
Gold grid cBot for XAUUSD H1: four-signal confluence on closed bars, ladders closed at a basket profit, news filter
15.6%
ROI
2.33
손익비
지표
ADX
ATR
+5
Ten confluence layers scored on every closed bar, with an anti-chop gate, pivot levels and a live dashboard.
지표
ADX
ATR
+5
SuperTrend signals scored on five confluence factors, with an ATR stop, three targets and a dashboard.
지표
ATR
EMA
+4
Range-filter BUY/SELL signals scored by four confluence layers, with a stop, five targets and a trend panel
cBot
ATR
RSI
+5
Buy-only gold grid cBot for XAUUSD M5: RSI extremes on the forming bar, two-step ladder, basket equity stop
4
손익비
cBot
RSI
SL Manager
+5
Gold breakout cBot with a prop-firm guard: pick your firm, phase and size; risk and limits come from the firm's rules
2
손익비

좋아하실 만한 다른 항목

지표
The Break of Structure (BoSCHoCh) Indicator is a smart market structure tool designed to help traders easily spot trend.
지표
Indices
Multi-Timeframe ADX Trend Dots & Arrows
지표
Customize your Moving Average! Choose any timeframe and price source for precision and flexibility in your analysis.
지표
RSI
RSI on the main chart with 45/55 momentum levels, overbought/oversold levels, averaged RSI, and multi-timeframe support.
지표
Prop
Forex
+13
Color Volume Bars – Visualize Market Strength Instantly
지표
AI
Forex
+7
Signal Strike is a professional trading indicator delivers clear, high‑confidence entry signals directly on your chart
지표
Volume
Order Block
+1
Elevate your market analysis with the Aggression Delta Volume Profile, a premium, institutional-grade order flow utility
지표
ADX
ATR
+5
Scored breakouts of sloped pivot trendlines: four filters on the break bar, ATR stop, 1:1 / 1:2 / 1:3 targets, alerts.
지표
AI
Signal
+1
🔥 THIS BURNS JP225 INDICATOR – Professional Trading Signals
지표
VWAP
Volume
+3
Track hidden trading activities to be on the right side of the market.
지표
BOS
Volume
+5
The Volume Delta Indicator using Institutional Level 2 DOM Data, The Edge Institutions Pay Millions For, now on cTrader
지표
ATR
Key Levels
It combines the trend-filtering power of Renko charts with the volatility tracking of ATR Bands
지표
SMC
Forex
+5
The only cTrader FVG indicator with Breakaway Gap detection, mitigation tracking, and full multi-asset compatibility.
지표
ATR
RSI
+5
Supply and demand zones with break of structure, higher timeframe MA signals, a percent stop and three targets.
지표
Shows daily and sessions highs / lows and session boxes, everything configurable
지표
Key Levels
Market Structure
+1
HTF Candle Projector displays the current Higher Timeframe candle (4H or 1H) as a real projected candle LIVE..
지표
Supertrend-based channel for entries, trailing stops, and dynamic support/resistance zones.
지표
ATR
BOS
+5
Clean Smart Money zones with filtered FVGs, confirmed BOS, Order Blocks, and automatic mitigation tracking.

가격

8
판매
164
무료 설치