present
Kaydolun ve ilk alışverişinizde $50 indirim kazanın
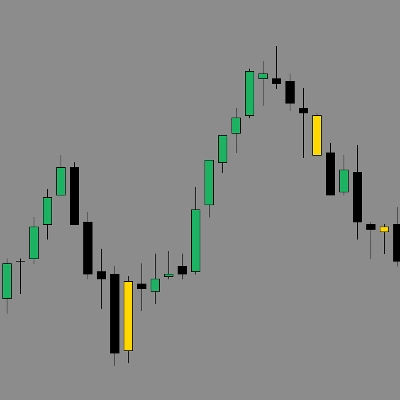
Trading product for Trend Sell Buy Gösterge Moving Average, image 2
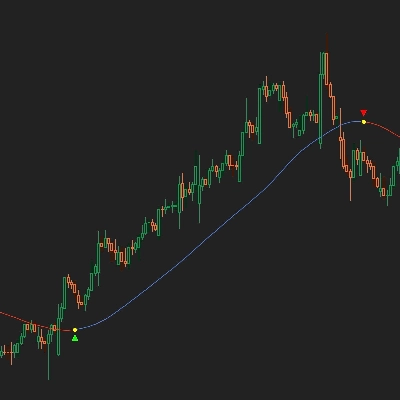
Trading product for Trend Sell Buy Gösterge Moving Average, image 3
Trading product for Trend Sell Buy Gösterge Moving Average, image 4
Trading product for Trend Sell Buy Gösterge Moving Average, image 5
Başlangıç 21/01/2025

Açıklama

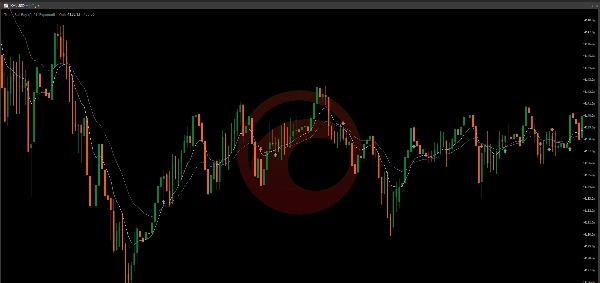
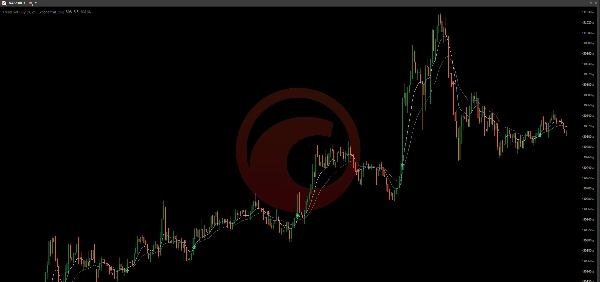
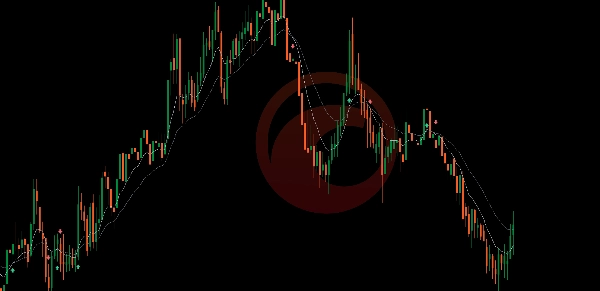
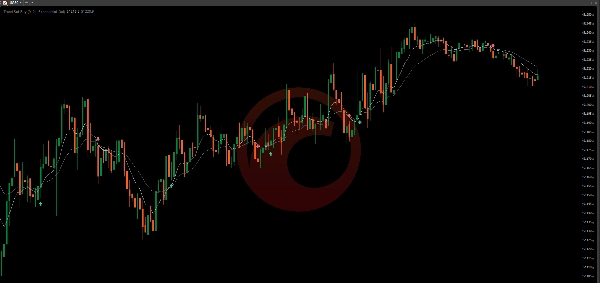
Trend Sell Buy, potansiyel yön değişikliklerini doğrudan işlem grafiğinde gösteren hafif bir trend göstergesidir. Kapanış fiyatlarını hızlı ve yavaş hareketli ortalamalarla analiz eder. Hızlı ortalama yavaş ortalamanın üzerine çıktığında yeşil bir Al oku, hızlı ortalama onun altına indiğinde kırmızı bir Sat oku görünür.


Ana ayarlar arasında Hızlı Periyot, Yavaş Periyot, hareketli ortalama türü ve ortalama çizgilerini gizleme seçeneği bulunur. Varsayılan periyotlar 9 ve 21 olup üssel ortalamalardır.


Gösterge, cTrader'da bulunan forex, endeksler, emtialar ve diğer semboller üzerinde kullanılabilir. Gün içi ve daha yüksek grafik periyotları için uygundur ve hareketli ortalama kesişimlerinin basit görsel onayını isteyen traderlar için tasarlanmıştır.


Trend Sell Buy işlem açmaz, değiştirmez veya kapatmaz. Sinyaller geçmiş kesişim koşullarını tanımlar ve yatay piyasalarda geç veya yanlış sinyaller verebilir. Her zaman kendi analiziniz ve risk yönetiminizle birleştirin.


Ticaret risk içerir. Geçmiş performans gelecekteki sonuçları garanti etmez.

Özet

YZ özeti
Trend Sell Buy is a trend indicator for cTrader that identifies potential trend changes using simple moving-average crossovers. It analyzes closing prices with two moving averages—a fast and a slow one—and marks crossover points directly on the chart. A green Buy arrow signals when the fast average crosses above the slow average, while a red Sell arrow indicates the opposite crossover. Key adjustable settings include the periods for the fast and slow averages, the type of moving average, and an option to hide the average lines. The default configuration uses exponential moving averages with periods of 9 and 21. This indicator supports various markets such as forex, indices, and commodities, and is suitable for intraday and longer timeframes. It provides visual confirmation of crossover signals but does not execute trades. Users should combine its signals with their own analysis and risk management. The indicator outputs visual signals based on historical crossover conditions.

Tartışma

Müşteri değerlendirmeleri

4.0
Değerlendirmeler: 1
5
0 %
4
100 %
3
0 %
2
0 %
1
0 %
Müşteri değerlendirmeleri
October 19, 2026
The 9 and 21 EMA arrows are easy to understand and the average lines can be hidden, making this a straightforward crossover display with the listing's acknowledged late and repeated signals in sideways markets.

SSS

Moving Average
Gösterge
Key Levels
Chart UI Tools
+2
Gösterge
Volume
Order Block
+3
Gösterge
"Oscillator Scanner" logosu
En yüksek puanlı
4.7
(4)
$20
Gösterge
ATR
RSI
+7
Gösterge
SMC
Forex
+9
Gösterge
Forex
Crypto
+5
Gösterge
XAUUSD
Commodities
Gösterge
AI
SMC
+13
Gösterge
Forex
Indices
+5
Gösterge
ATR
Volume
+3
Gösterge
ATR
RSI
+16
Gösterge
Forex
Crypto
+3
Gösterge
BOS
EMA
+5
Gösterge
Moving Average
"Inside Candle" logosu
En yüksek puanlı
4.5
(4)
$19
Gösterge
ATR
RSI
+16
Gösterge
Forex
BTCUSD
+10
Gösterge
Fibonacci
Key Levels
+5
Gösterge
Doji
Wedge
+5

Fiyat