Açıklama
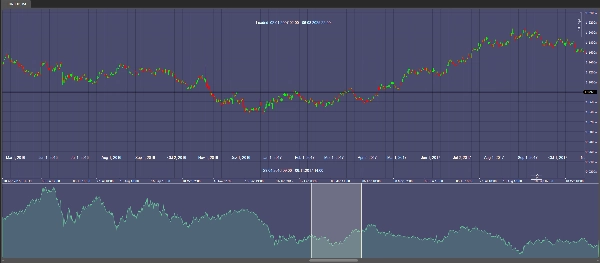
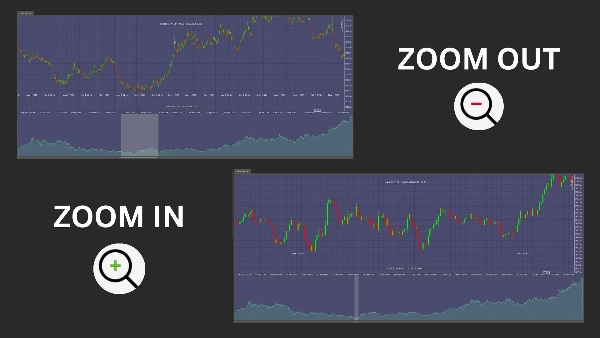
ChartOverview, en erken veriden en son mevcut veri noktasına kadar piyasanın tüm veri aralığı hakkında sizi tamamen bilgilendirir. Grafiğinizin üst kısmında, yüklenen tam zaman diliminin net bir görüntüsünü görürsünüz, mevcut görünür dönem ise gerçek zamanlı içgörüler için doğrudan grafikte gösterilir.
Bu dinamik gösterge, kaydırdığınızda, sürüklediğinizde veya grafiğinizin boyutunu değiştirdiğinizde sorunsuz bir şekilde güncellenir, böylece her zaman güncel bilgilere sahip olmanızı sağlar. Sezgisel tasarımı, piyasa trendlerini ve fırsatlarını hızlıca tanımlamanıza olanak tanır ve zamanında, iyi bilgilendirilmiş ticaret kararları alma yeteneğinizi artırır.
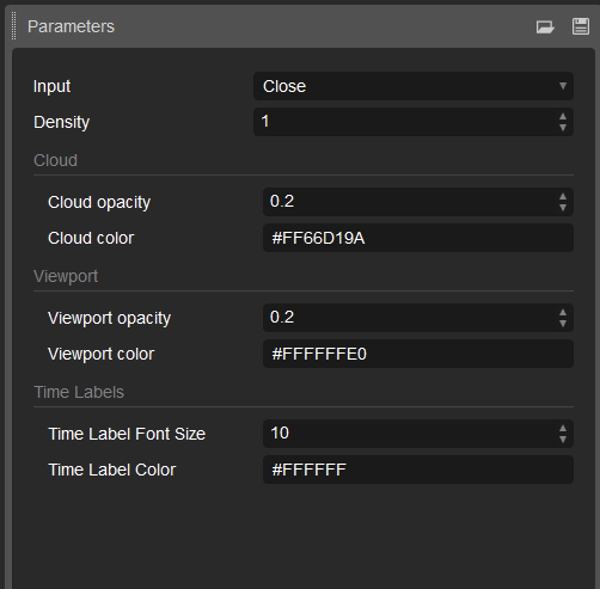
Renkler, opaklık ve görüntü ayarları için geniş özelleştirme seçenekleriyle, ChartOverview kişisel ticaret düzeninize mükemmel şekilde entegre olur. Analizinizi güçlendirin ve hassas ve kapsamlı bir piyasa genel görünümü sunmak üzere tasarlanmış bir araçla rekabet avantajı kazanın.
Özet
Müşteri değerlendirmeleri
5 | 100 % | |
4 | 0 % | |
3 | 0 % | |
2 | 0 % | |
1 | 0 % |