Descrição
📈 RSI Estocástico
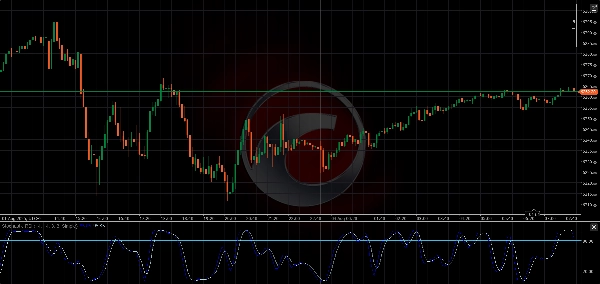
O indicador RSI Estocástico é um oscilador de momento que aplica a fórmula Estocástica aos valores do RSI em vez do preço, tornando-o um indicador de segunda derivada. É particularmente útil para identificar condições de sobrecompra e sobrevenda com maior sensibilidade do que o RSI padrão.
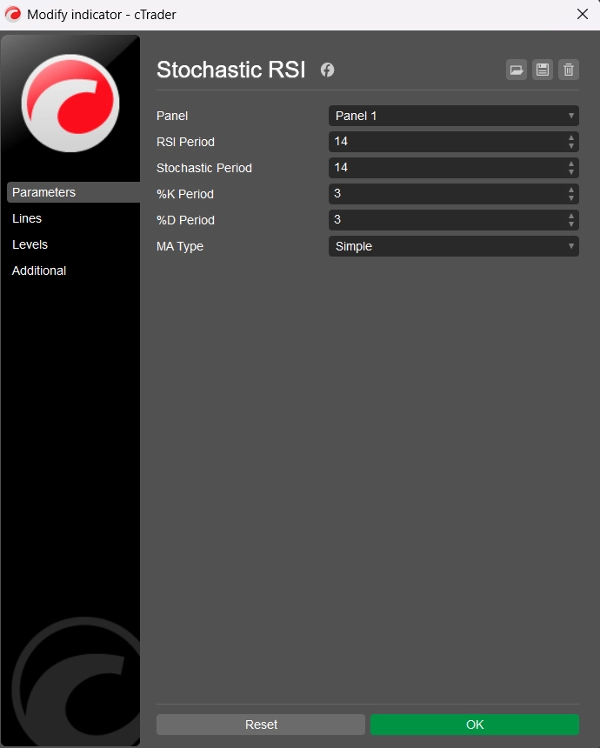
🛠️ Parâmetros
Período do RSI: O período de retrocesso usado para calcular o RSI base (padrão = 14)
Período Estocástico: O período de retrocesso aplicado aos valores do RSI para calcular o RSI Estocástico (padrão = 14)
Período %K: O período de suavização para a linha %K (padrão = 3)
Período %D: O período de suavização para a linha %D (padrão = 3)
Tipo de MA: Tipo de média móvel para suavização: Simples ou Exponencial (padrão = Simples)
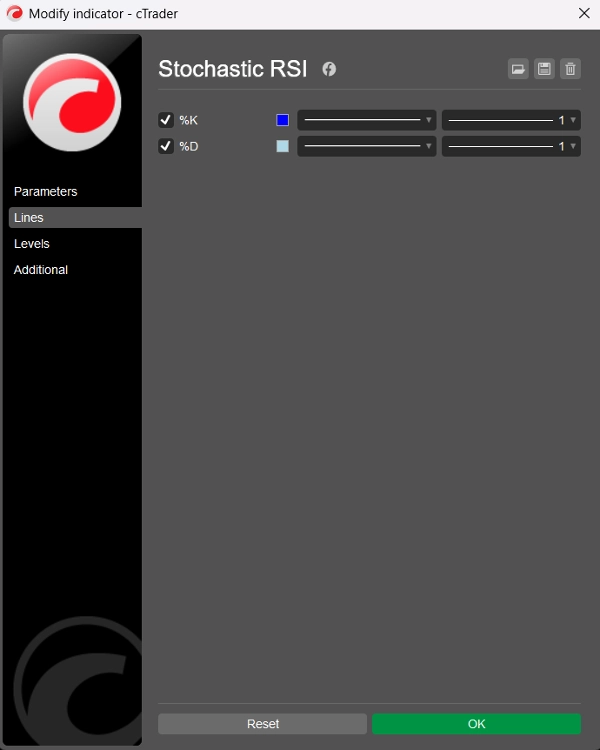
📊 Linhas de Saída
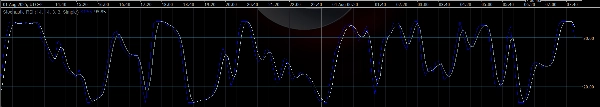
- Linha %K: RSI Estocástico suavizado (azul)
- Linha %D: Média móvel suavizada de %K (azul claro)
Ambas as linhas oscilam entre 0 e 100, permitindo leituras claras de sobrecompra e sobrevenda.
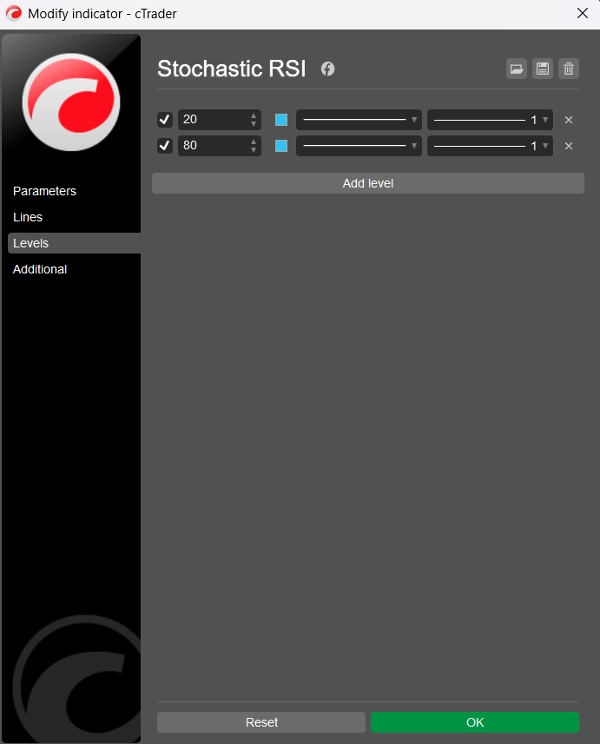
⚠️ Níveis Sugeridos
Embora o indicador não exiba níveis estáticos por padrão, recomenda-se que os usuários adicionem esses manualmente através da aba “Níveis” no cTrader:
- Nível 80 → Sobrecomprado
- Nível 20 → Sobrevendido
Esses níveis funcionam de forma semelhante ao Oscilador Estocástico tradicional, mas aplicados ao comportamento do RSI, tornando os sinais mais nítidos e frequentemente mais rápidos.
🧠 Como Usar
- Sobrecomprado (>80): Pode indicar que o preço está estendido para cima — potencial para reversão ou consolidação.
- Sobrevendido (<20): Pode sinalizar que o preço está sobrevendido — possível repique ou reversão de tendência.
- Cruzamentos %K e %D: Podem ser usados de forma semelhante ao Estocástico ou MACD — um cruzamento de alta abaixo de 20 ou cruzamento de baixa acima de 80 pode ser acionável.
🏷️ Notas
- Construído para cTrader usando C# e a API Automate
- Limpo, eficiente e personalizável com dois tipos de MA
- Código e lógica por BlueRocketBots & ChatGPT (OpenAI)
- Código limpo (total de 109 linhas; 60 linhas de código, 29 linhas de texto, 20 linhas vazias)
- Grátis!