
Description
Le ZLEMA (Moyenne Mobile Exponentielle à Décalage Zéro) est une version avancée de la Moyenne Mobile Exponentielle (EMA) conçue pour réduire le décalage couramment associé aux EMA traditionnelles. En utilisant une méthode de calcul spécialisée, le ZLEMA réagit plus rapidement aux variations de prix, ce qui le rend particulièrement efficace sur les marchés volatils.
La caractéristique clé du ZLEMA est son aspect « zéro décalage », lui permettant de suivre les mouvements de prix de plus près, notamment dans des conditions de marché à évolution rapide. Comparé à l'EMA traditionnelle, le ZLEMA offre des temps de réponse plus rapides, ce qui le rend plus opportun pour capter les tendances du marché.
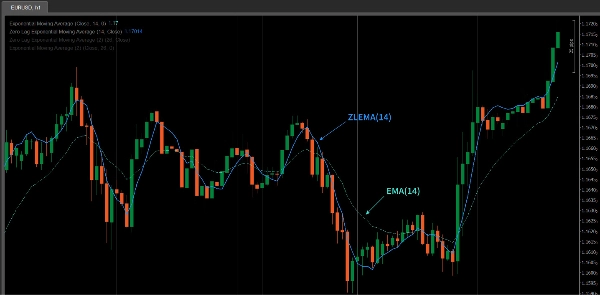
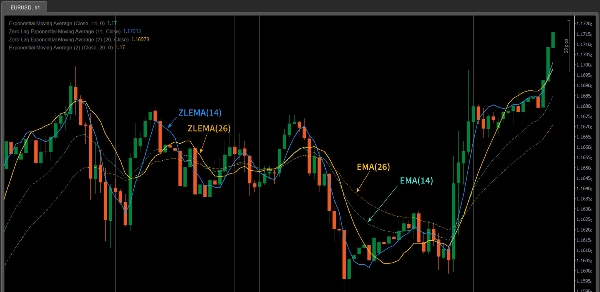
ZLEMA vs EMA
- Vitesse de Réponse : Le ZLEMA réagit plus rapidement que l'EMA traditionnelle. En compensant le décalage, il suit les changements de prix plus promptement.
- Effet de Lissage : Le ZLEMA maintient un effet de lissage similaire à celui de l'EMA, tout en minimisant le décalage des prix, ce qui le rend mieux adapté aux marchés à évolution rapide.
- Cas d'Utilisation : Si vous tradez sur un marché très volatil (comme le trading à court terme ou intrajournalier), le ZLEMA peut surpasser l'EMA en termes de réactivité.
Caractéristiques de l'Indicateur ZLEMA
- Réponse à Décalage Zéro : Le ZLEMA réduit le décalage, lui permettant de répondre rapidement aux fluctuations des prix du marché, ce qui le rend plus précis pour capter les changements rapides du marché.
- Lissage : Malgré une réactivité plus rapide, le ZLEMA conserve l'effet de lissage de l'EMA, aidant à éviter le bruit causé par les fluctuations de prix.
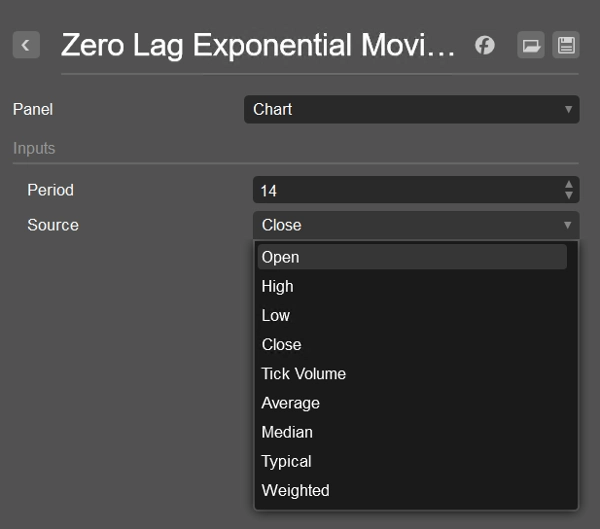
- Flexibilité : Le ZLEMA peut être utilisé avec différentes sources de données de prix (comme
Close,Open,High, etc.), permettant aux traders de l'ajuster selon leurs besoins stratégiques. - Suivi de Tendance et Confirmation de Signal de Renversement : Le ZLEMA est idéal pour identifier les changements de tendance, surtout sur les marchés volatils, et confirmer les signaux de renversement de prix.
Comment Utiliser l'Indicateur ZLEMA
- Traders à Court Terme : Le ZLEMA est parfait pour les traders à court terme car il peut réagir rapidement aux fluctuations de prix. Sa réaction rapide le rend idéal pour capter les renversements de tendance à court terme ou les signaux de cassure.
- Suivi de Tendance : Le ZLEMA peut également être utilisé pour suivre les tendances à long terme mais offre une sensibilité plus grande que l'EMA. Dans une tendance forte, le ZLEMA aide à identifier plus rapidement le début ou la fin des tendances, facilitant des ajustements stratégiques en temps utile.
- Combinaison avec d'Autres Indicateurs : Le ZLEMA fonctionne bien lorsqu'il est combiné avec d'autres indicateurs techniques tels que RSI, MACD ou l'analyse des motifs de prix pour améliorer la précision des signaux. Il est particulièrement utile lorsqu'il est combiné avec des indicateurs de suivi de tendance comme les moyennes mobiles pour confirmer les cassures ou renversements de prix.
- Confirmation des Cassures et Renversements : Le ZLEMA peut aider à confirmer les cassures de prix à partir de niveaux clés ou les signaux de renversement. Par exemple, lorsque le prix croise la ligne ZLEMA, cela peut indiquer un changement de tendance, et inversement.
- Réduction du Bruit : En raison de son décalage réduit, le ZLEMA est meilleur pour filtrer le bruit qui pourrait être présent dans les moyennes mobiles traditionnelles, ce qui en fait un outil important dans le trading intrajournalier ou sur des marchés très volatils.
Conseils pour Utiliser le ZLEMA
- Ajustez la Période : Ajustez la période du ZLEMA en fonction de votre style de trading et de la volatilité du marché. Pour les trades à court terme, utilisez une période plus courte (par exemple, 10 ou 14), tandis que pour le suivi des tendances à long terme, une période plus longue (par exemple, 50 ou 100) peut être plus appropriée.
- Combinez avec d'Autres Outils : Bien que le ZLEMA offre d'excellentes capacités de suivi de tendance, le combiner avec d'autres indicateurs comme le RSI pour les conditions de surachat/survente ou le MACD pour la force de la tendance peut améliorer la précision.
- Test et Optimisation : Les performances du ZLEMA peuvent varier selon les conditions de marché. Il est recommandé de le backtester et de l'optimiser soigneusement avant de l'utiliser en trading réel afin d'assurer les meilleurs résultats dans votre stratégie.
Résumé
Key features include:
- Zero lag response for timely reaction to price fluctuations.
- Smoothness that filters out noise without sacrificing responsiveness.
- Flexibility to use various price data inputs such as Close, Open, or High prices.
- Utility in trend following and confirming reversal signals.
ZLEMA is particularly useful for short-term traders seeking to capture rapid trend reversals or breakouts, as well as for longer-term trend tracking with enhanced sensitivity compared to EMA. It can be combined with other indicators like RSI or MACD to improve signal accuracy and confirm price breakouts or reversals.
Users can adjust the indicator’s period to match their trading style and market conditions, optimizing performance through backtesting. ZLEMA helps reduce noise and lag, making it a valuable tool for intraday and volatile market trading.


