
Mô tả
TỔNG QUAN
Chỉ báo Waddah Attar Explosion (WAE) được tạo ra bởi Ahmad Waddah Attar và giới thiệu đến cộng đồng giao dịch vào năm 2007. Nó kết hợp đo lường động lượng MACD với phân tích biến động Bollinger Bands để xác định những khoảnh khắc "bùng nổ giá" — những khoảng thời gian khi giá chuyển từ giai đoạn tích lũy sang chuyển động theo hướng mạnh mẽ.
Chỉ báo trả lời hai câu hỏi:
- Động lượng có đang tăng lên không? (được đo bằng tốc độ thay đổi MACD)
- Biến động có đang mở rộng không? (được đo bằng độ rộng Bollinger Bands)
Khi cả hai điều kiện đều vượt qua bộ lọc nhiễu (Vùng Chết), nó báo hiệu một chuyển động bùng nổ tiềm năng.
THÀNH PHẦN
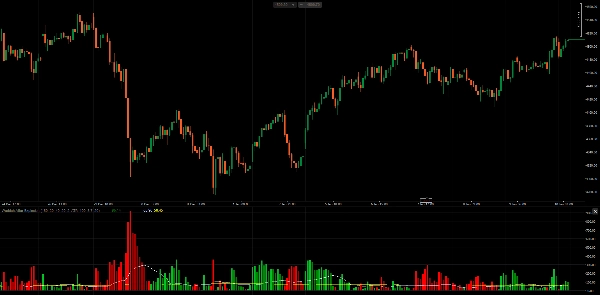
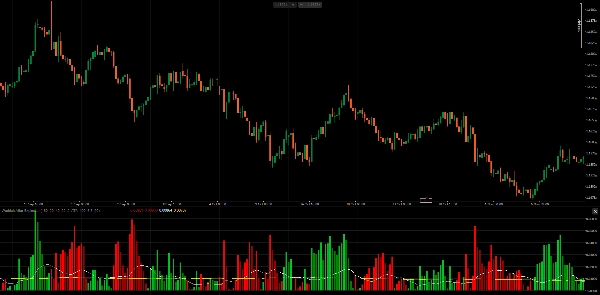
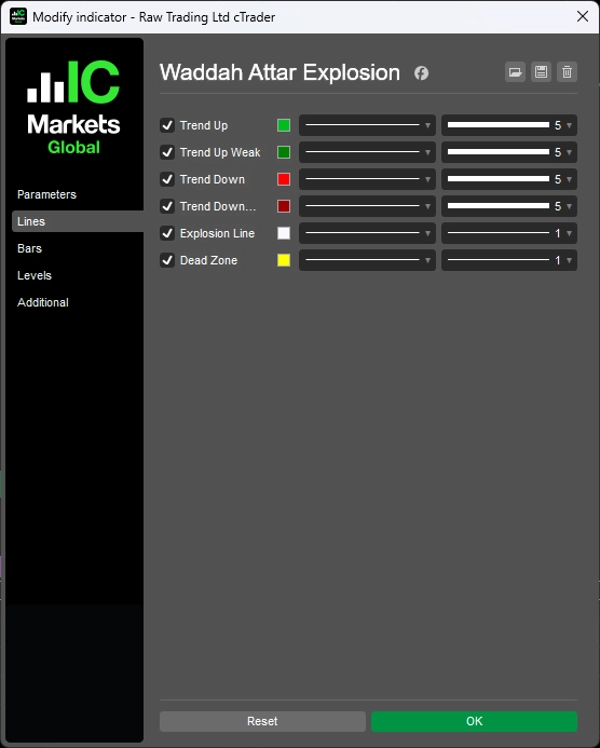
1. Biểu đồ cột xu hướng (Xanh lá/Đỏ) Hiển thị tốc độ thay đổi của đường MACD, nhân với một hệ số nhạy cảm.
- Công thức tính:
(MACD_hiện_tại - MACD_trước_đó) × Độ nhạy - Cột màu xanh: Động lượng tăng (MACD tăng tốc lên trên)
- Cột màu đỏ: Động lượng giảm (MACD tăng tốc xuống dưới)
- Màu sáng: Động lượng tăng so với cột trước
- Màu tối: Động lượng giảm so với cột trước
2. Đường Bùng Nổ (Màu Trắng) Đại diện cho độ rộng của Bollinger Bands, chỉ ra sự mở rộng hoặc thu hẹp biến động.
- Công thức tính:
BB_Trên - BB_Dưới - Tăng: Biến động mở rộng (có khả năng bứt phá)
- Giảm: Biến động thu hẹp (tích lũy)
3. Vùng Chết (Màu Vàng) Bộ lọc ngưỡng để loại bỏ các tín hiệu yếu do nhiễu thị trường gây ra.
- Dựa trên ATR: Thích ứng với biến động thị trường hiện tại
- Pips cố định: Giá trị ngưỡng cố định
CÁCH AHMAD WADDAH ATTAR SỬ DỤNG
Theo tác giả gốc:
Quy tắc vào lệnh mua Tất cả các điều kiện phải được đáp ứng:
- Biểu đồ cột màu xanh đang tăng
- Biểu đồ cột màu xanh nằm trên Đường Bùng Nổ
- Đường Bùng Nổ đang tăng
- Cả biểu đồ cột màu xanh và Đường Bùng Nổ đều nằm trên Vùng Chết
Quy tắc vào lệnh bán Tất cả các điều kiện phải được đáp ứng:
- Biểu đồ cột màu đỏ đang tăng
- Biểu đồ cột màu đỏ nằm trên Đường Bùng Nổ
- Đường Bùng Nổ đang tăng
- Cả biểu đồ cột màu đỏ và Đường Bùng Nổ đều nằm trên Vùng Chết
Quy tắc thoát lệnh
- Thoát lệnh mua khi biểu đồ cột màu xanh cắt xuống dưới Đường Bùng Nổ
- Thoát lệnh bán khi biểu đồ cột màu đỏ cắt xuống dưới Đường Bùng Nổ
Điểm quan trọng Góc của Đường Bùng Nổ rất quan trọng. Khi Đường Bùng Nổ nghiêng lên trên và biểu đồ cột phá vỡ lên trên nó, điều này xác nhận rằng biến động đang tăng lên tích cực — "vụ nổ" là thật, không phải tín hiệu giả.
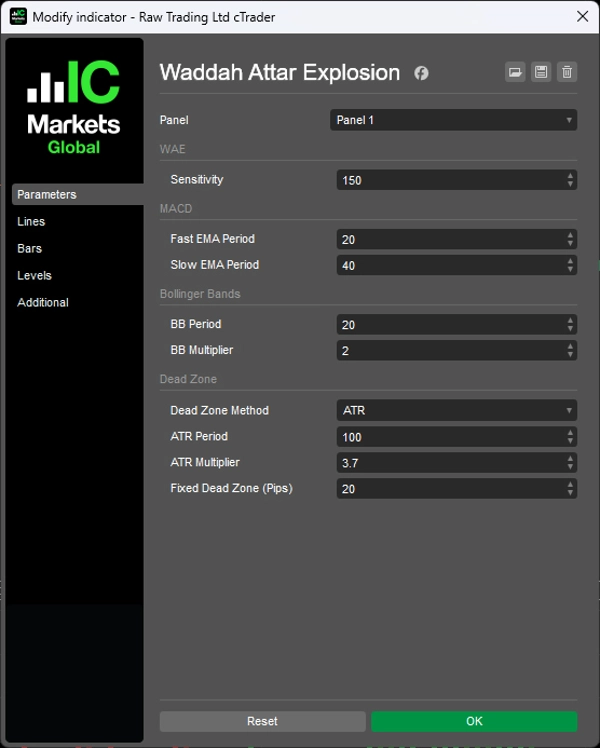
THAM SỐ
1. Độ nhạy
- Độ nhạy (150): Hệ số nhân cho tốc độ thay đổi MACD
2. MACD
- Chu kỳ EMA nhanh (20): Trung bình động nhanh cho tính toán MACD
- Chu kỳ EMA chậm (40): Trung bình động chậm cho tính toán MACD
3. Bollinger Bands
- Chu kỳ BB (20): Chu kỳ nhìn lại của Bollinger Bands
- Hệ số nhân BB (2.0): Hệ số nhân độ lệch chuẩn
4. Vùng Chết
- Phương pháp Vùng Chết (ATR): Chọn giữa dựa trên ATR hoặc Pips cố định
- Chu kỳ ATR (100): Chu kỳ tính ATR
- Hệ số nhân ATR (3.7): Hệ số nhân áp dụng cho ATR để xác định Vùng Chết
- Vùng Chết cố định (20): Giá trị Vùng Chết tính bằng pips (khi sử dụng phương pháp cố định)
GHI CHÚ
- Chỉ báo hoạt động trên tất cả các khung thời gian. Tác giả gốc khuyến nghị sử dụng H1 và M30.
- Vùng Chết dựa trên ATR được khuyến nghị vì nó thích ứng với các công cụ và điều kiện thị trường khác nhau.
- Tham số Độ nhạy có thể cần điều chỉnh dựa trên khung thời gian và biến động công cụ.
- Chỉ báo này xác định sự đồng thuận giữa động lượng và biến động — nó không dự đoán hướng đi một cách độc lập. Hãy cân nhắc sử dụng cùng với phân tích xu hướng hoặc các mức hỗ trợ/kháng cự.
__________________________________________________________________________________________
NHIỀU CHỈ BÁO MIỄN PHÍ KHÁC
Khám phá nhiều công cụ phân tích thị trường — từ cấu trúc và khối lượng đến hồi quy, biến động và khung thời gian tùy chỉnh.
Mã nguồn có sẵn trên kho GitHub.
Tất cả đều miễn phí sử dụng. Nhưng nếu bạn muốn hỗ trợ cà phê, bạn có thể gửi tại đây.
Hỗ trợ/Kháng cự
Khối lượng
- Volume Activity Profiler
- Volume Efficiency Analyzer
- Volume Profile Analytics
- Volume Profile - Cập nhật
- Volume Spread Analysis
- VWAP (Giá trung bình trọng số theo khối lượng)
Trung bình động
- Kênh SSL
- Trung bình động neo
- Trung bình động tỷ lệ lệch
- Bộ kích hoạt Gann High Low
- Đường xu hướng tức thời
- Trung bình động thích ứng Kaufman với Trend Vision
- Kênh Trung bình động
- Bộ Trung bình động
- Trung bình động kênh xu hướng
Tiện ích/Tùy chỉnh
Dựa trên hồi quy
Biến động
Bộ dao động
__________________________________________________________________________________________
TỪ CHỐI TRÁCH NHIỆM
Giao dịch có rủi ro. Chỉ báo này chỉ dành cho phân tích kỹ thuật — luôn áp dụng quản lý rủi ro phù hợp và giao dịch có trách nhiệm.
PHẢN HỒI & CẢI TIẾN
Nếu bạn có đề xuất, yêu cầu tính năng hoặc ý tưởng cải tiến, vui lòng để lại bình luận trong tab Thảo luận. Phản hồi của bạn giúp cải thiện chỉ báo cho mọi người.


