
Mô tả
TeoriaCutrim là một chỉ báo phủ chồng thống kê được thiết kế để định lượng hành vi thị trường gần đây thông qua phân phối nến và phân tích biến động. Thay vì dự đoán hướng đi, nó cung cấp dữ liệu khách quan về những gì thị trường vừa làm trong một cửa sổ nến có thể cấu hình.
Dữ liệu thị trường được phân tích
Chỉ báo đánh giá một số lượng nến gần đây do người dùng định nghĩa (giai đoạn Lookback) và trích xuất:
- Số lượng và tỷ lệ phần trăm nến tăng (đóng cửa > mở cửa)
- Số lượng và tỷ lệ phần trăm nến giảm (đóng cửa < mở cửa)
- Sự khác biệt giữa sự thống trị của nến tăng và nến giảm
- Phạm vi trung bình của nến (tính bằng pip)
- Phạm vi nến hiện tại (tính bằng pip)
- Tổng phạm vi giá trong cửa sổ được phân tích
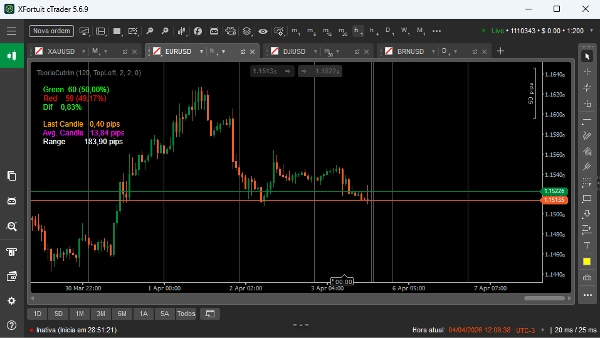
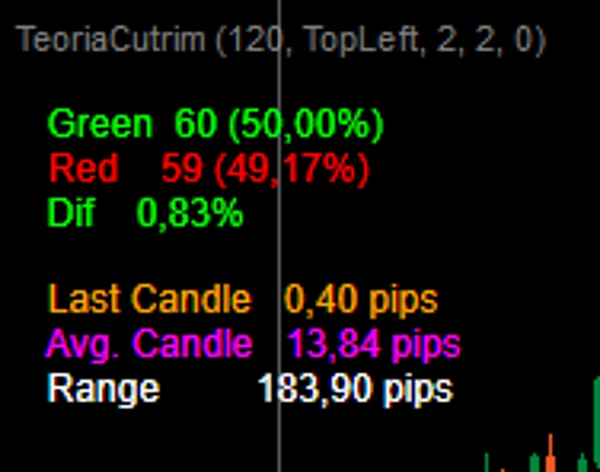
Hiển thị trực quan và giải thích
Chỉ báo hiển thị các chỉ số chính trực tiếp trên biểu đồ:
- Màu xanh lá: tổng số nến tăng và tỷ lệ phần trăm
- Màu đỏ: tổng số nến giảm và tỷ lệ phần trăm
- Dif: sự khác biệt tuyệt đối giữa tỷ lệ phần trăm nến tăng và nến giảm
- Nến cuối: kích thước nến hiện tại tính bằng pip
- Nến trung bình: kích thước trung bình của các nến trong cửa sổ được chọn
- Phạm vi: khoảng cách giữa đỉnh cao nhất và đáy thấp nhất trong cửa sổ
Giải thích rất đơn giản:
- Số lượng nến tăng cao hơn cho thấy áp lực tăng gần đây
- Số lượng nến giảm cao hơn cho thấy áp lực giảm gần đây
- Sự khác biệt thấp (Dif) chỉ ra sự cân bằng hoặc ngẫu nhiên
- Kích thước nến trung bình tăng cho thấy biến động đang mở rộng
- Phạm vi tổng lớn cho thấy thị trường đang mở rộng, trong khi phạm vi nhỏ cho thấy sự nén
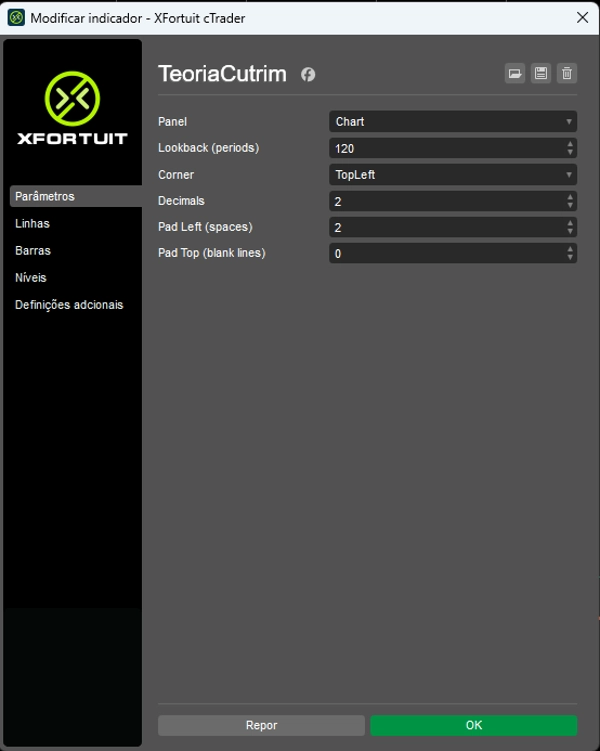
Các tham số chính
- Lookback: số lượng nến được sử dụng để phân tích (có thể điều chỉnh hoàn toàn)
- Corner: vị trí hiển thị dữ liệu trên màn hình
- Decimals: số chữ số thập phân được hiển thị
- Pad Left / Pad Top: điều chỉnh khoảng cách hiển thị
Các trường hợp sử dụng
TeoriaCutrim được sử dụng tốt nhất như một công cụ bối cảnh, không phải là bộ tạo tín hiệu. Các ứng dụng điển hình bao gồm:
- Đo lường sự mất cân bằng thống kê trước khi vào lệnh
- Xác định sự mở rộng hoặc co lại của biến động
- Lọc các giao dịch dựa trên hành vi nến gần đây
- Hỗ trợ các chiến lược định lượng hoặc dựa trên xác suất
Người dùng mục tiêu
Chỉ báo này được thiết kế cho các nhà giao dịch dựa vào dữ liệu, thống kê và phân tích khách quan thay vì nhận dạng mẫu chủ quan. Phù hợp cho cả nhà giao dịch tùy ý và hệ thống.


