Mô tả
3-Bar Reversal
📊 NÓ LÀ GÌ?
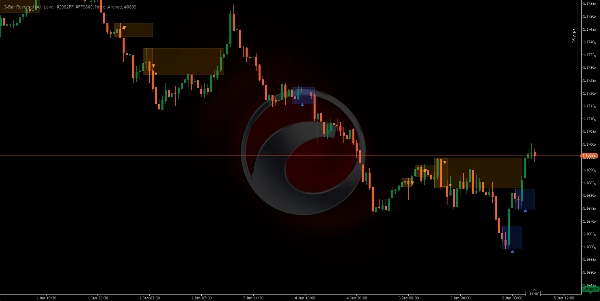
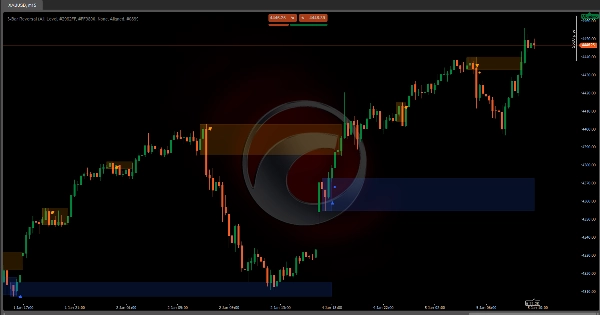
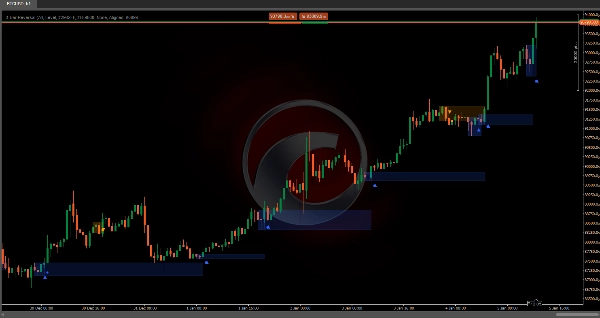
Chỉ báo kỹ thuật 3-Bar Reversal xác định các mẫu đảo chiều cụ thể được tạo thành bởi chính xác ba cây nến liên tiếp. Mẫu cổ điển này báo hiệu khả năng thay đổi hướng giá thông qua cấu trúc trực quan rõ ràng: một cây nến xu hướng, một cây nến kiệt sức và một cây nến đảo chiều.
🎯 MỤC ĐÍCH LÀ GÌ?
Chỉ báo này giúp nhà giao dịch:
- Phát hiện các đảo chiều tăng và giảm với cấu trúc 3 cây nến
- Lọc các tín hiệu sai thông qua xác nhận xu hướng có thể cấu hình
- Xác định các vùng hỗ trợ và kháng cự dựa trên các mẫu đã được xác nhận
- Hiển thị cơ hội giao dịch với các dấu hiệu biểu đồ trực quan
- Giao dịch các đảo chiều có xác suất cao trên bất kỳ khung thời gian nào
🔍 NÓ HOẠT ĐỘNG NHƯ THẾ NÀO?
Mẫu tăng (3-Bar Bullish Reversal)
Cấu trúc ba cây nến:
- Nến 1 (Giảm): Đóng cửa dưới giá mở - xác nhận áp lực bán
- Nến 2 (Kiệt sức giảm): Tạo đáy mới VÀ đỉnh mới thấp hơn nến 1, với đóng cửa giảm - tín hiệu đầu hàng ⚠️
- Nến 3 (Đảo chiều tăng): Đóng cửa trên giá mở VÀ đỉnh cao hơn đỉnh nến 1 - xác nhận sự chuyển đổi kiểm soát ✅
Mẫu giảm (3-Bar Bearish Reversal)
Cấu trúc ngược lại:
- Nến 1 (Tăng): Đóng cửa trên giá mở - xác nhận áp lực mua
- Nến 2 (Mở rộng tăng): Tạo đỉnh mới VÀ đáy mới cao hơn nến 1, với đóng cửa tăng - tín hiệu quá mức ⚠️
- Nến 3 (Đảo chiều giảm): Đóng cửa dưới giá mở VÀ đáy thấp hơn đáy nến 1 - xác nhận sự chuyển đổi kiểm soát ✅
Hệ thống Quản lý Trực quan (Máy trạng thái)
Chỉ báo xử lý mỗi mẫu theo ba giai đoạn tuần tự:
GIAI ĐOẠN 1 - PHÁT HIỆN MẪU: 🔍
- Xác định cấu trúc 3 cây nến hoàn chỉnh
- Một chỉ báo tam giác (▲ tăng / ▼ giảm) xuất hiện trên cây nến thứ ba
- Một hình chữ nhật thiết lập bán trong suốt được vẽ bao phủ:
-
- Tăng: Từ đỉnh nến 1 đến đáy thấp nhất (nến 2 hoặc 3)
- Giảm: Từ đáy nến 1 đến đỉnh cao nhất (nến 2 hoặc 3)
- Hình chữ nhật này đánh dấu "vùng chiến đấu" nơi đảo chiều xảy ra
GIAI ĐOẠN 2 - XÁC NHẬN HOẶC HỦY BỎ: ⏳
Hệ thống chờ cây nến tiếp theo sau mẫu để xác thực nó:
Xác nhận tăng: ✅
- Đóng cửa của cây nến tiếp theo phải vượt qua đỉnh nến 1 (trần hình chữ nhật)
- Một chấm đặc (●) xuất hiện đánh dấu xác nhận
- Hình chữ nhật trở thành vùng hỗ trợ hoạt động
Xác nhận giảm: ✅
- Đóng cửa của cây nến tiếp theo phải phá vỡ đáy nến 1 (sàn hình chữ nhật)
- Một chấm đặc (●) xuất hiện đánh dấu xác nhận
- Hình chữ nhật trở thành vùng kháng cự hoạt động
Hủy bỏ: ❌
- Tăng thất bại nếu: đóng cửa dưới mức tối thiểu của hình chữ nhật HOẶC xuất hiện mẫu giảm
- Giảm thất bại nếu: đóng cửa trên mức tối đa của hình chữ nhật HOẶC xuất hiện mẫu tăng
- Hình chữ nhật ngừng mở rộng (mẫu chết)
Chờ mở rộng: ⏸️
- Nếu không có xác nhận hoặc thất bại, hình chữ nhật mở rộng ngang theo từng cây nến
GIAI ĐOẠN 3 - VÙNG HỖ TRỢ/KHÁNG CỰ HOẠT ĐỘNG: 🎯
- Khi được xác nhận, vùng mở rộng vô thời hạn về bên phải
- Vùng tăng: Vẫn hoạt động khi giá duy trì trên sàn
- Vùng giảm: Vẫn hoạt động khi giá duy trì dưới trần
- Vùng bị vô hiệu hóa khi giá phá vỡ hoàn toàn theo hướng ngược lại
⚙️ CẤU HÌNH CHÍNH
Chế độ mẫu
Kiểm soát các biến thể mẫu được chấp nhận:
- Bình thường: Chỉ chấp nhận khi nến 3 đóng trong phạm vi của nến 1
-
- Tăng: Đóng cửa < đỉnh nến 1 (đảo chiều vừa phải)
- Giảm: Đóng cửa > đáy nến 1 (đảo chiều vừa phải)
- Nâng cao: Chỉ chấp nhận khi nến 3 đóng ngoài phạm vi của nến 1 🔥
-
- Tăng: Đóng cửa > đỉnh nến 1 (đảo chiều bùng nổ)
- Giảm: Đóng cửa < đáy nến 1 (đảo chiều bùng nổ)
- Tất cả (Khuyến nghị): Chấp nhận cả hai loại không phân biệt ⭐
Loại Hỗ trợ/Kháng cự
- Cấp độ: Chức năng đường cơ bản (giới hạn trong phiên bản này)
- Vùng: Vẽ các hình chữ nhật có bóng đánh dấu vùng SR sau khi xác nhận 📦
- Không có: Không có vùng SR, chỉ hiển thị các mẫu đã phát hiện
Màu sắc có thể tùy chỉnh 🎨
- Màu đảo chiều tăng: Cho tam giác, hình chữ nhật và vùng tăng (mặc định:
#2962FF- xanh dương) - Màu đảo chiều giảm: Cho tam giác, hình chữ nhật và vùng giảm (mặc định:
#FF9800- cam) - Màu xu hướng tăng: Cho trực quan bộ lọc xu hướng (mặc định:
#089981- xanh lá) - Màu xu hướng giảm: Cho trực quan bộ lọc xu hướng (mặc định:
#F23645- đỏ)
🔧 BỘ LỌC XU HƯỚNG
Chỉ báo có thể lọc các mẫu dựa trên hướng xu hướng tổng thể bằng bốn phương pháp:
1. Đám mây Trung bình Động ☁️
Sử dụng hai đường trung bình động để xác định xu hướng:
Tham số:
- Loại Trung bình Động: Đơn giản, Lũy thừa, Hull, Trọng số, v.v. (mặc định: Hull)
- Chu kỳ Nhanh: 50 (mặc định)
- Chu kỳ Chậm: 200 (mặc định)
Logic lọc (Căn chỉnh):
- Phát hiện xu hướng tăng khi: Giá > MA Nhanh VÀ MA Nhanh > MA Chậm ✅
- Phát hiện xu hướng giảm khi: Giá < MA Nhanh VÀ MA Nhanh < MA Chậm ✅
- Chỉ hiển thị mẫu tăng trong xu hướng tăng và mẫu giảm trong xu hướng giảm
Logic ngược (Ngược lại):
- Đảo ngược điều kiện để bắt các đảo chiều ngược xu hướng chính
2. Supertrend 📈
Chỉ báo theo xu hướng dựa trên biến động (ATR):
Tham số:
- Chu kỳ ATR: 10 (mặc định) - cửa sổ tính biến động
- Hệ số nhân: 3.0 (mặc định) - độ nhạy chỉ báo
Logic:
- Tính toán dải trên và dải dưới sử dụng ATR
- Giá trên Supertrend = xu hướng tăng 🟢
- Giá dưới Supertrend = xu hướng giảm 🔴
- Lọc các mẫu theo căn chỉnh đã cấu hình
3. Kênh Donchian 📊
Sử dụng các cực giá trong một khoảng thời gian:
Tham số:
- Độ dài kênh: 13 (mặc định)
Logic:
- Kênh trên = đỉnh cao nhất của N kỳ
- Kênh dưới = đáy thấp nhất của N kỳ
- Điểm giữa = (trên + dưới) / 2
- Giá trên điểm giữa = xu hướng tăng 🟢
- Giá dưới điểm giữa = xu hướng giảm 🔴
4. Không (Không lọc) 🔓
Hiển thị TẤT CẢ các mẫu 3-bar đã phát hiện mà không xét đến xu hướng tổng thể. Hữu ích cho:
- Thị trường đi ngang
- Phân tích mẫu thuần túy
- Giao dịch đảo chiều trong mọi bối cảnh
Căn chỉnh xu hướng
Áp dụng khi bộ lọc đang hoạt động:
- Căn chỉnh: Chỉ hiển thị các mẫu đi THEO xu hướng đã xác định ➡️
-
- Chỉ mẫu tăng trong xu hướng tăng
- Chỉ mẫu giảm trong xu hướng giảm
- Ngược lại: Chỉ hiển thị các mẫu đi NGƯỢC lại xu hướng đã xác định 🔄
-
- Mẫu tăng trong xu hướng giảm (đảo chiều lớn)
- Mẫu giảm trong xu hướng tăng (đảo chiều lớn)
Tóm tắt
It operates in three phases: pattern detection, confirmation or invalidation based on the next candle's behavior, and establishing active support or resistance zones that extend while price respects them. The indicator supports configurable pattern modes (Normal, Enhanced, or All) to control acceptance criteria for reversals.
Trend filtering is available through four methods—Moving Average Cloud, Supertrend, Donchian Channels, or no filter—allowing users to align pattern signals with overall market trends or capture counter-trend reversals. Confirmed reversal zones are displayed as shaded rectangles or levels, customizable in color for bullish and bearish signals, trend filters, and zones.
This tool is designed for use on any timeframe and across various markets, including forex pairs (EURUSD, GBPUSD, USDJPY, NZDUSD), commodities (XAUUSD), indices (NAS100), and cryptocurrencies (BTCUSD). It aids traders in detecting high-probability reversals, filtering false signals, and identifying support and resistance zones with clear visual markers.