
ADX and ADI
Chỉ báo
258 lượt tải
Phiên bản 1.0, Aug 2025
Windows, Mac
5.0
Đánh giá: 2
Kể từ 21/02/2025
466.3M
Khối lượng đã giao dịch
180.83K
Pip đạt được
21
Lượt bán
6.73K
Cài đặt miễn phí
Các tính năng chính:
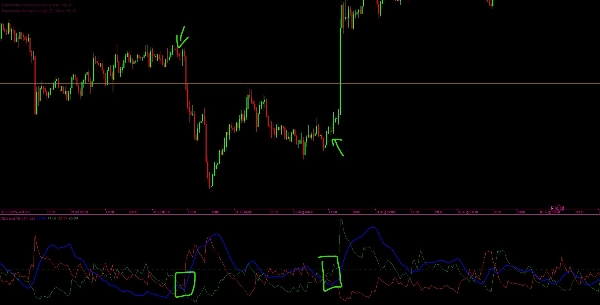
- Đường ADX và ADI (Màu xanh): Hiển thị độ mạnh đã được làm mượt của xu hướng hiện tại, bất kể hướng đi.
- Đường +DI (Màu xanh lá): Chỉ ra sức mạnh của các chuyển động đi lên.
- Đường -DI (Màu đỏ): Chỉ ra sức mạnh của các chuyển động đi xuống.
- Đường ngưỡng (Màu xám): Một mức tham chiếu ngang (mặc định 25) để giúp xác định xem sức mạnh xu hướng có đáng kể hay không.
Cách hoạt động:
- Chỉ báo tính toán True Range (TR), Positive Directional Movement (+DM), và Negative Directional Movement (-DM).
- Nó áp dụng kỹ thuật làm mượt của Wilder để tính các giá trị đã được làm mượt của TR, +DM, và -DM.
- Từ đó, các Chỉ báo Hướng (+DI và -DI) được suy ra, cho thấy bên nào (tăng giá hay giảm giá) có động lực mạnh hơn.
- Đường DX (Directional Index) được tính từ sự khác biệt tương đối giữa +DI và -DI.
- Cuối cùng, ADX (Average Directional Index) được tính như một phiên bản làm mượt của DX, cung cấp thước đo về độ mạnh tổng thể của xu hướng.
Diễn giải:
- Khi ADX nằm trên ngưỡng (ví dụ, 25), thị trường được coi là đang có xu hướng mạnh.
- Khi +DI > -DI, phe bò đang kiểm soát (xu hướng tăng).
- Khi -DI > +DI, phe gấu đang kiểm soát (xu hướng giảm).
- Khi ADX nằm dưới ngưỡng, thị trường được coi là đang đi ngang (yếu hoặc không có xu hướng).
Hồ sơ chỉ báo
5.0
Đánh giá: 2
5 | 100 % | |
4 | 0 % | |
3 | 0 % | |
2 | 0 % | |
1 | 0 % |
Đánh giá của khách hàng
December 1, 2025
ADX and ADI delivers clean trend strength and direction signals. ADX shows when the market is actually trending, while +DI and -DI reveal who’s in control. Stable, lightweight and reliable across all timeframes. Best on H1+ for smoother signals. Alerts and zone-highlighting would be great additions.
September 12, 2025
Các sản phẩm có sẵn trên cTrader Store, bao gồm bot giao dịch, chỉ báo và plugin, được cung cấp bởi các nhà phát triển bên thứ ba và chỉ nhằm mục đích cung cấp thông tin và tiếp cận kỹ thuật. cTrader Store không phải là nhà môi giới và không cung cấp lời khuyên đầu tư, khuyến nghị cá nhân hay bất kỳ đảm bảo nào về hiệu suất trong tương lai.


Kể từ 21/02/2025
466.3M
Khối lượng đã giao dịch
180.83K
Pip đạt được
21
Lượt bán
6.73K
Cài đặt miễn phí