
Mô tả
Ultimate RSI (Chỉ số sức mạnh tương đối)
The Ultimate RSI là một bộ dao động tiên tiến và tùy chỉnh được thiết kế để cung cấp một phép đo mượt mà hơn, sạch hơn và phản ứng nhanh hơn về đà thị trường và độ mạnh xu hướng. Nó đại diện cho một nâng cấp đáng kể so với Chỉ số sức mạnh tương đối (RSI) truyền thống, tập trung vào việc lọc bỏ nhiễu thị trường và giảm thiểu các tín hiệu sai (whipsaws). Điều này làm cho nó trở thành một công cụ vô giá để xác nhận xu hướng và xác định các điểm đảo chiều đáng tin cậy.
Các tính năng và cải tiến chính:
- Tính toán đà được tăng cường: Chỉ báo sử dụng một phương pháp tinh vi để tính toán sự thay đổi giá. Thay vì chỉ dựa vào biến động giá hàng ngày, tín hiệu đà được củng cố đáng kể khi giá ghi nhận mức cao mới hoặc mức thấp mới trong khoảng thời gian xem lại. Quá trình này đảm bảo chỉ báo phản ứng mạnh mẽ với các đột phá thực sự trong khi bỏ qua các biến động nhỏ, lộn xộn.
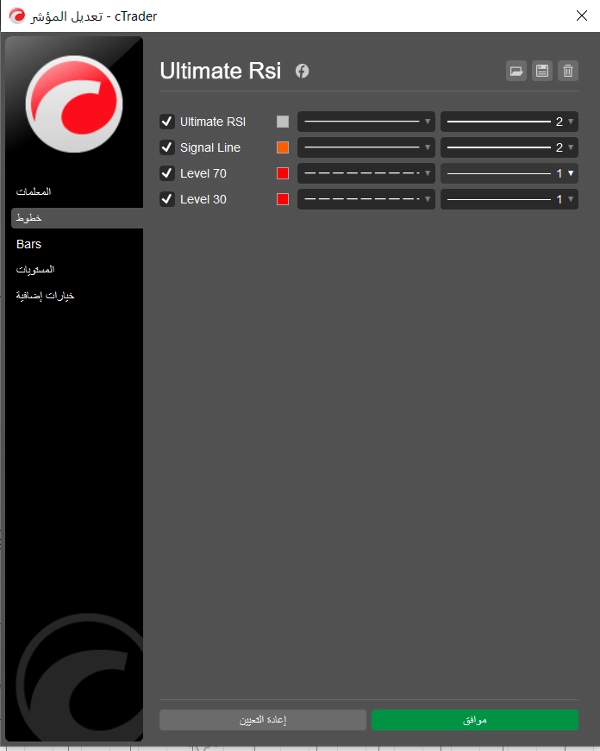
- Đường tín hiệu riêng biệt: Nó bao gồm một Đường tín hiệu riêng biệt (một trung bình động của chính RSI) có thể được cấu hình độc lập. Các điểm giao cắt giữa đường Ultimate RSI và Đường tín hiệu thường được sử dụng như các tín hiệu kích hoạt rõ ràng hơn, có độ tin cậy cao hơn cho việc vào hoặc thoát lệnh, đặc biệt là gần các mức quá mua/quá bán.
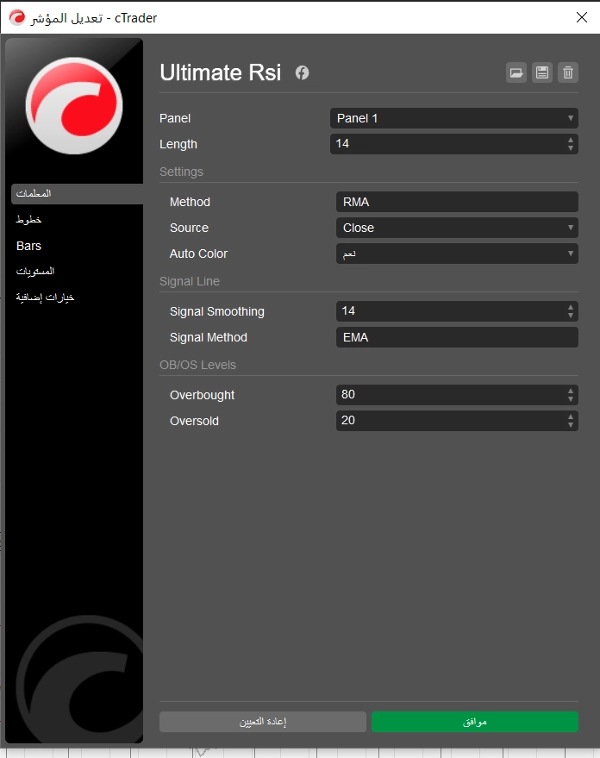
- Phương pháp làm mượt linh hoạt: Người dùng có thể linh hoạt chọn loại làm mượt cho cả phép tính RSI và Đường tín hiệu từ các tùy chọn phổ biến: EMA (Trung bình động hàm mũ), SMA (Trung bình động đơn giản), RMA (Trung bình động Wilder), và TMA (Trung bình động tam giác). Điều này cho phép tùy chỉnh chính xác độ nhạy của chỉ báo.
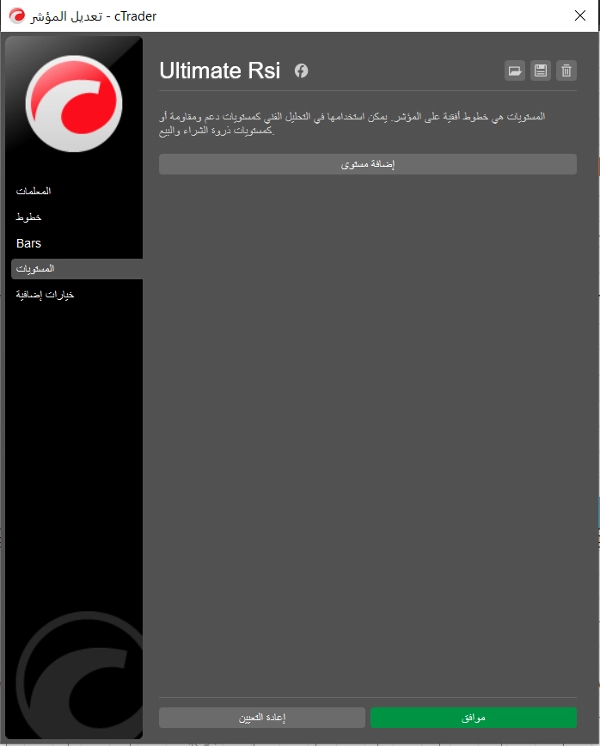
- Vùng OB/OS trực quan: Mức quá mua (OB) mặc định tại 80 và mức quá bán (OS) tại 20 được đánh dấu rõ ràng bằng nền màu. Trong các thị trường xu hướng mạnh, các chỉ số duy trì trong các vùng này thường cho thấy độ mạnh xu hướng đặc biệt thay vì đảo chiều ngay lập tức, cung cấp một công cụ xác nhận mạnh mẽ cho các chiến lược theo xu hướng.
Cách giao dịch với Ultimate RSI:
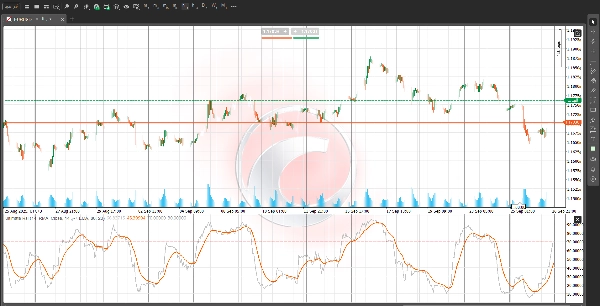
- Xác nhận xu hướng: Sử dụng mức 50 làm trung tâm đà. Đọc số liên tục trên 50 xác nhận xu hướng tăng, trong khi đọc số dưới 50 xác nhận xu hướng giảm.
- Tín hiệu vào lệnh: Tìm đường Ultimate RSI cắt lên trên Đường tín hiệu để vào lệnh mua tiềm năng, và cắt xuống dưới Đường tín hiệu để vào lệnh bán tiềm năng, chú ý kỹ nơi các điểm giao cắt này xảy ra so với mức 50.
- Giảm nhiễu: Bằng cách nhấn mạnh sự mở rộng phạm vi thực và sử dụng làm mượt nâng cao, Ultimate RSI giúp nhà giao dịch duy trì tập trung trong các giai đoạn tích lũy, tránh vào hoặc thoát lệnh quá sớm.
Tuyên bố từ chối trách nhiệm: Mô tả này chỉ nhằm mục đích cung cấp thông tin và giáo dục. Giao dịch có rủi ro, và tất cả các chỉ báo nên được kết hợp với phân tích hành động giá toàn diện cho bất kỳ quyết định giao dịch nào.


![Logo "[CB] Pivot Points Pro"](https://cdn.ctrader.com/image/webp/43463c82-67b0-4f10-a4ba-901bba091d81_32594)

