
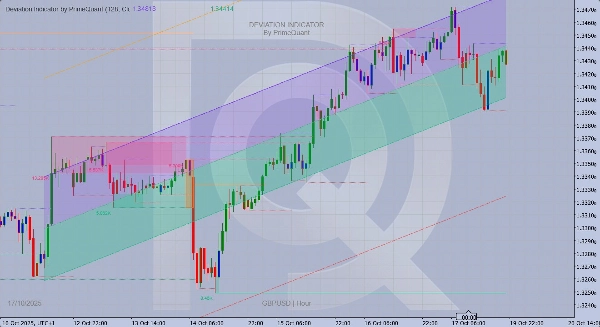
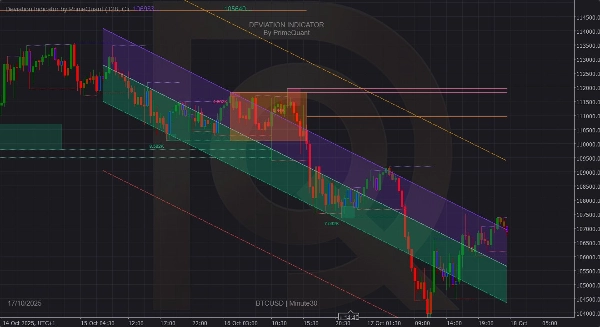
Deviation Indicator by PrimeQuant
Chỉ báo
Phiên bản 1.0, Oct 2025
Windows, Mac
5.0
Đánh giá: 3
Mô tả
- 📈 Nó là gì
Một bộ công cụ chuyên nghiệp kết hợp các kênh Sai lệch Thực, Khái niệm Tiền Thông minh (đỉnh/đáy dao động & thanh khoản), và xu hướng xung lực Elder để giúp bạn xác định thời điểm đảo chiều, phá vỡ động lượng và hồi cấu trúc. - 💡 Tại sao các nhà giao dịch yêu thích nó
- Phát hiện cực điểm có xác suất cao để chơi lướt hoặc tiếp tục
- Bản đồ cấu trúc (vùng dao động) theo cách các tổ chức theo dõi
- Làm nổi bật các mức thanh khoản thường được nhắm mục tiêu trước các động thái thực sự
- Thêm bộ lọc xu hướng xung lực để tránh chống lại điều kiện xu hướng
- 🧰 Bạn nhận được gì
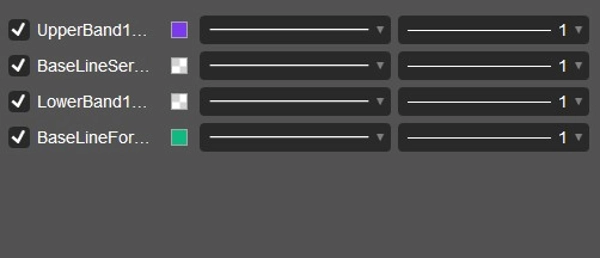
- Kênh Sai lệch Thích ứng: các dải trong/ngoài quanh đường cơ sở hồi quy lăn
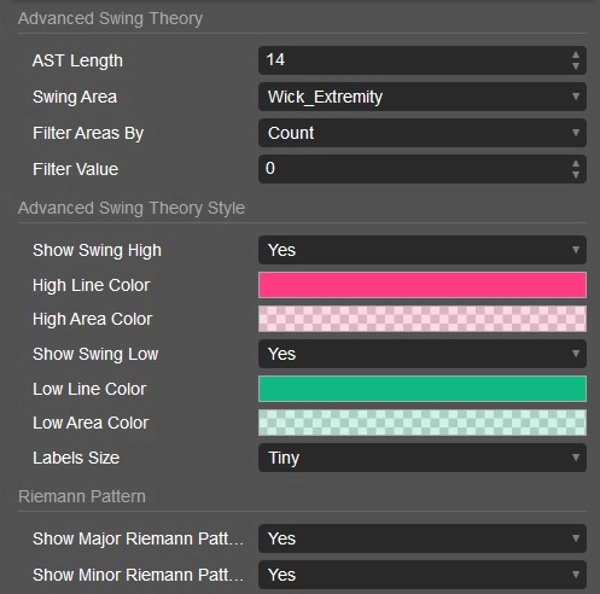
- Vùng Dao động SMC: đỉnh/đáy dao động tự động với tùy chọn điền vùng
- Mức Thanh khoản: các mức chấm chấm theo dõi các vùng quét có khả năng xảy ra
- Ống Kính Mẫu Riemann: các đường trung bình phạm vi trung bình bên trong các hộp lớn/nhỏ
- Xu hướng Xung lực Elder: tín hiệu trực quan nhanh về động lượng so với xu hướng
- Bảng Màu Sạch: mặc định hiện đại, độ tương phản cao (thân thiện với chủ đề tối & sáng)
- Chữ ký & Thông tin: thương hiệu tinh tế với hiển thị ký hiệu/khung thời gian
- 🧭 Cách sử dụng (bắt đầu nhanh)
- Xác định cực điểm: Giá chạm sai lệch ngoài → tìm kiếm sự từ chối hoặc phá vỡ có kiểm soát.
- Xác nhận cấu trúc: Kiểm tra vùng dao động (H/L) gần đó và thanh khoản — các cú giả thường xảy ra.
- Kiểm tra xu hướng: Elder Impulse xanh/đỏ/xanh dương để đồng bộ hoặc tránh vào lệnh.
- Lập kế hoạch giao dịch:
-
- Đảo chiều: lướt dải ngoài trở lại đường cơ sở hoặc đường giữa.
- Phá vỡ: chờ đóng cửa vượt qua dải + thay đổi cấu trúc.
- Quản lý rủi ro: Đặt điểm dừng vượt qua vùng dao động/hộp, chia tỷ lệ tại đường cơ sở hoặc dải đối diện.
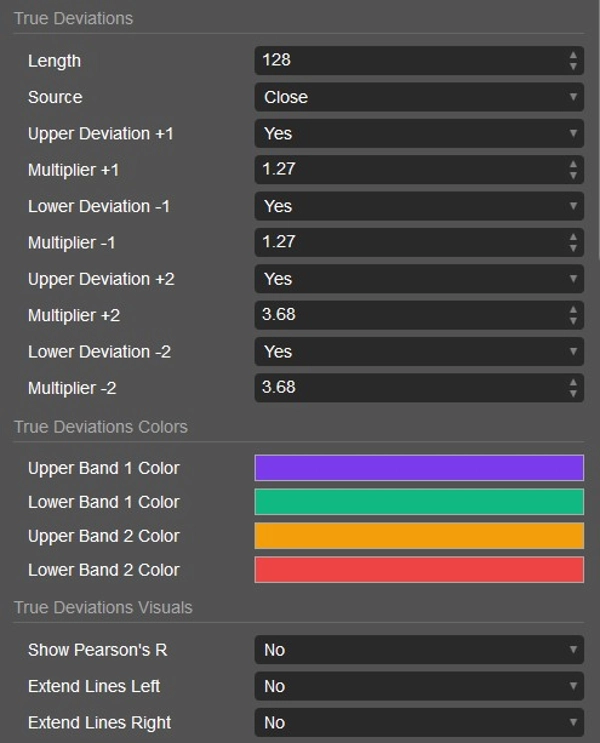
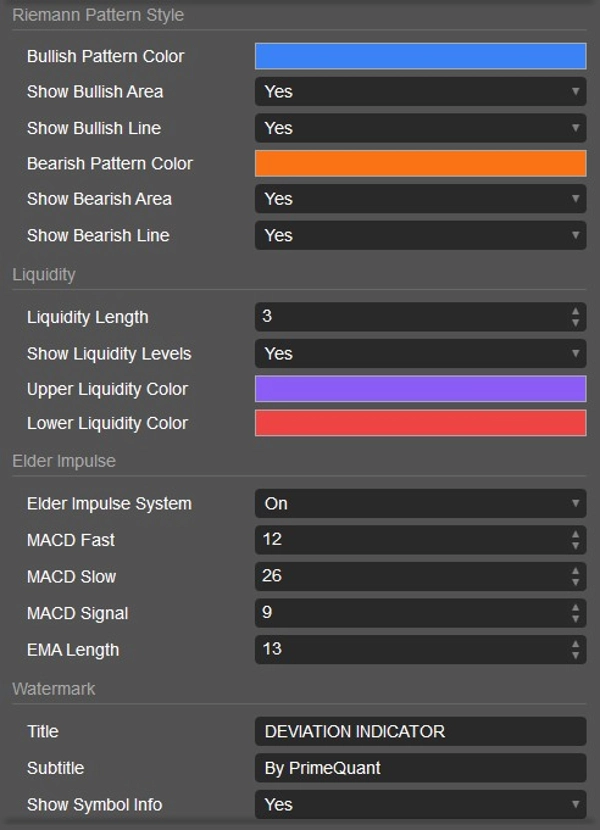
- ⚙️ Các tham số chính
- Độ dài: khoảng nhìn lại cho toán học hồi quy & sai lệch (mặc định 128)
- Nguồn: cơ sở giá (Đóng cửa, các biến thể OHLC)
- Hệ số Sai lệch: điều chỉnh độ nhạy của dải trong/ngoài
- Chế độ Vùng Dao động: độ dài bấc so với phạm vi nến đầy đủ
- Bộ lọc: theo số lần chạm hoặc khối lượng tham gia
- Độ dài Thanh khoản: độ rộng pivot để phát hiện mức
- Cài đặt Xung lực: đầu vào MACD/EMA cho tô màu xu hướng
- Hình ảnh: màu sắc, điền, kiểu đường, văn bản chữ ký
- 🧪 Ý tưởng kịch bản chơi
- Lướt sóng đảo chiều trung bình: Chạm dải ngoài + màu xung lực ngược → mục tiêu đường cơ sở.
- Phá vỡ cấu trúc: Quét thanh khoản qua mức dao động, sau đó đóng cửa vượt dải trong → đi đến dải ngoài.
- Hồi tiếp tục: Xung lực xanh, hồi về đường cơ sở/dải trong tại thanh khoản trước → tiếp tục xu hướng.
- 🧭 Áp dụng cho
Forex, Chỉ số, Hàng hóa, Tiền điện tử và Cổ phiếu; tất cả khung thời gian từ lướt sóng đến dao động. - 👤 Dành cho ai
Các nhà giao dịch muốn một bản đồ trực quan cho cực điểm + cấu trúc + thanh khoản + xu hướng mà không bị rối mắt. - ⚠️ Tuyên bố từ chối trách nhiệm
Đây là công cụ hỗ trợ quyết định, không phải lời khuyên tài chính. Luôn thử nghiệm trên tài khoản demo và sử dụng quản lý rủi ro nghiêm ngặt.
Tóm tắt
Hồ sơ chỉ báo
Đánh giá của khách hàng
5.0
Đánh giá: 3
5 | 100 % | |
4 | 0 % | |
3 | 0 % | |
2 | 0 % | |
1 | 0 % |
Đánh giá của khách hàng
October 28, 2025
Demo first, then maybe small size if the notes look sane. A small account test feels safer.
October 23, 2025
the only reason it stays interesting is it makes forced ideas less tempting. It needs a boring test before bigger size.
October 20, 2025
RSI 30 and 70 keeps the first run grounded. Thin setups are easier to reject.
Thảo luận
Câu hỏi thường gặp
BTCUSD
Forex
Signal
Breakout
Indices
EURUSD
Commodities
GBPUSD
NZDUSD
Fibonacci
Prop
ZigZag
Fair Value Gap
SMC
Crypto
Stocks
XAUUSD
NAS100
MACD
USDJPY
Các sản phẩm có sẵn trên cTrader Store, bao gồm bot giao dịch, chỉ báo và plugin, được cung cấp bởi các nhà phát triển bên thứ ba và chỉ nhằm mục đích cung cấp thông tin và tiếp cận kỹ thuật. cTrader Store không phải là nhà môi giới và không cung cấp lời khuyên đầu tư, khuyến nghị cá nhân hay bất kỳ đảm bảo nào về hiệu suất trong tương lai.


Giá
46
Lượt bán
3.95K
Cài đặt miễn phí