
Mô tả
**Vmm Signal Trend Pro - Chỉ báo cho cTrader**
**Mô Tả Chung**
Vmm Signal Trend Pro là một chỉ báo phân tích kỹ thuật tiên tiến cho nền tảng cTrader, phát hiện nhiều mẫu giá trong thời gian thực. Nó kết hợp phát hiện xu hướng, mẫu nến, FVGs (Khoảng Giá Trị Công Bằng), khoảng trống và các mẫu quan trọng khác thành một chỉ báo trực quan duy nhất.
**Tính Năng Chính**
**1. Phát Hiện Xu Hướng**
- **Phân tích Hành động Giá**: Xác định xu hướng qua hành động giá trên N cây nến gần nhất
- **Độ Mạnh Xu Hướng**: Tính phần trăm độ mạnh dựa trên động lượng và cấu trúc
- **Biểu Tượng Hướng**: Mũi tên xanh (lên) hoặc mũi tên đỏ (xuống) khi xu hướng mạnh
**2. Mẫu Phát Hiện**
**Khoảng Giá Trị Công Bằng (FVG)**
- **FVG Tăng**: Khi đáy hiện tại > đỉnh của 2 cây nến trước
- **FVG Giảm**: Khi đỉnh hiện tại < đáy của 2 cây nến trước
- **Khu Vực Màu Sắc**: Hình chữ nhật bán trong suốt (xanh lá/cam)
**Khoảng Trống**
- **Khoảng Trống Tăng**: Mở cửa cao hơn đỉnh trước đó
- **Khoảng Trống Giảm**: Mở cửa thấp hơn đáy trước đó
- **Hiển Thị**: Hình chữ nhật nhỏ tại điểm mở cửa nến
**Inside Bars**
- Nến nằm hoàn toàn trong phạm vi của nến trước đó
- Phân biệt bằng màu sắc (vàng/cam) dựa trên hướng
**Mẫu 123 (Đảo Chiều)**
- **Mẫu 123 Tăng**: Ba điểm với sự phá vỡ lên trên
- **Mẫu 123 Giảm**: Ba điểm với sự phá vỡ xuống dưới
- **Biểu Tượng**: Hình tròn màu Vàng
**Mẫu Bóng Nến**
- **Giống Búa**: Bóng dưới dài đáng kể
- **Giống Sao Băng**: Bóng trên dài đáng kể
- **Biểu Tượng**: Ngôi sao màu Hồng
**Pin Bars**
- Bóng dài (≥2 lần thân nến) với thân nhỏ
- Phát hiện các mức quan trọng gần đó
- **Biểu Tượng**: Tam giác lên/xuống (xanh lam nhạt)
**Engulfing**
- **Engulfing Tăng**: Nến tăng bao phủ nến giảm trước đó
- **Engulfing Giảm**: Nến giảm bao phủ nến tăng trước đó
- **Biểu Tượng**: Hình thoi màu Tím
**Doji**
- Thân nến rất nhỏ (≤10% phạm vi tổng mặc định)
- Các loại đặc biệt: Gravestone, Dragonfly, Long-Legged
- **Biểu Tượng**: Hình tròn màu Xám
**3.** Hệ Thống Hỗ Trợ/Kháng Cự**
- Tự động phát hiện đỉnh/đáy swing
- Xem xét gần các mức quan trọng để tăng độ tin cậy
**4. Lọc Thông Minh**
- **Giới hạn theo loại**: Số lượng tín hiệu tối đa mỗi loại
- **Khoảng cách thời gian**: Tránh tín hiệu quá gần nhau
- **Bộ lọc xu hướng**: Tùy chọn cho phép/không cho tín hiệu ngược xu hướng
- **Độ mạnh tối thiểu**: Lọc tín hiệu yếu
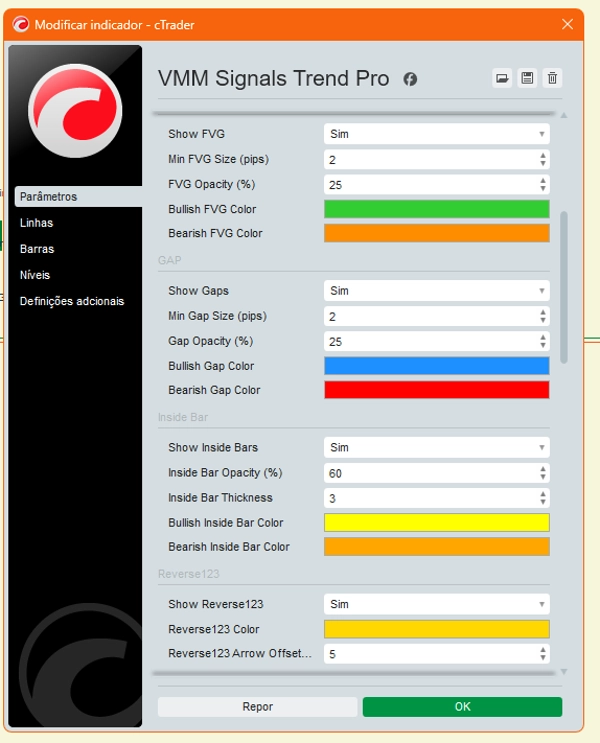
**Tham Số Có Thể Cấu Hình**
**Cơ Bản**
- `Hiển thị hướng xu hướng`: Kích hoạt mũi tên xu hướng
- `Kiểm tra các cây nến trước`: Số lượng nến để phân tích
- `Ngưỡng độ mạnh xu hướng`: Phần trăm tối thiểu để xem là xu hướng mạnh
**FVG**
- `Kích thước FVG tối thiểu`: Kích thước tối thiểu tính bằng pip
- `Độ mờ`: Độ trong suốt của khu vực
- `Màu sắc`: Màu có thể tùy chỉnh
**Khoảng Trống**
- `Kích thước khoảng trống tối thiểu`: Kích thước tối thiểu tính bằng pip
- `Màu sắc`: Màu cho khoảng trống tăng/giảm
**Inside Bars**
- `Độ dày`: Độ dày đường kẻ
- Độ mờ: Độ trong suốt
- Màu sắc: Màu phân biệt theo hướng
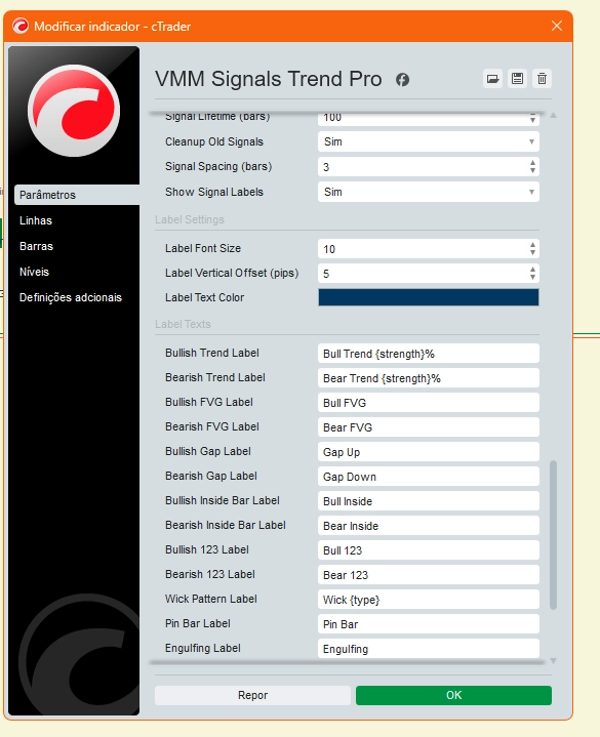
Tín hiệu:
- Thời gian tồn tại tín hiệu: Thời gian tín hiệu (tính theo nến)
- Khoảng cách tín hiệu: Khoảng cách tối thiểu giữa các tín hiệu
- Số tín hiệu tối đa mỗi loại: Giới hạn theo danh mục
Nhãn tùy chỉnh:
- Văn bản tùy chỉnh: Mỗi mẫu có văn bản cấu hình riêng
- Chỗ giữ chỗ: `{strength}` cho % độ mạnh, `{type}` cho loại cụ thể
- Định dạng: Kích thước font, độ lệch dọc, màu sắc
- Chế độ ngắn: Nhãn viết tắt cho biểu đồ dày đặc
Cơ chế nội bộ:
1. Phân tích xu hướng:
- Hồi quy tuyến tính: Tính độ dốc xu hướng
- Đếm nến: Số lượng nến tăng so với giảm trong N kỳ gần nhất
- Động lượng: Xem xét cường độ các chuyển động
2. Quản lý đối tượng**
- **Bộ nhớ đệm đối tượng**: Ngăn chặn vẽ lại các tín hiệu đã tồn tại
- **Dọn dẹp tự động**: Loại bỏ tín hiệu cũ dựa trên thời gian tồn tại
- **Bộ đếm theo loại**: Kiểm soát số lượng tối đa
**3. **Tính Toán Độ Mạnh**
- Mỗi mẫu có công thức tính độ mạnh riêng
- Dựa trên tỷ lệ, khoảng cách pip, gần các mức quan trọng
- Phạm vi: 0-100%
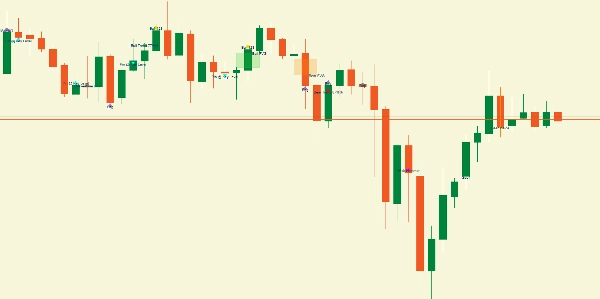
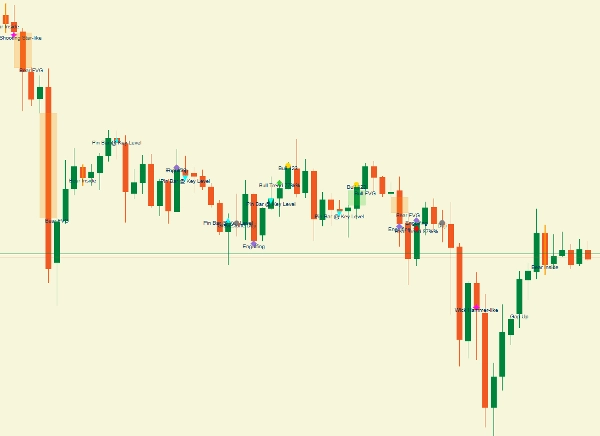
**Hiển Thị Biểu Đồ**
**Các Thành Phần Biểu Đồ**
1. **Biểu tượng**: Mũi tên, tam giác, vòng tròn, hình thoi, ngôi sao
2. **Khu vực**: Hình chữ nhật bán trong suốt (FVG/Khoảng trống)
3. **Đường kẻ**: Làm nổi bật inside bars
4. **Nhãn**: Văn bản thông tin bên cạnh tín hiệu
**Mã Màu**
- **Xanh lá**: Tăng (xu hướng, FVG, khoảng trống)
- **Đỏ/Cam**: Giảm (xu hướng, FVG, khoảng trống)
- **Vàng/Cam**: Inside bars (tăng/giảm)
- **Vàng**: Mẫu 123
- **Hồng**: Mẫu bóng nến
- **Xanh lam nhạt**: Pin bars
- **Tím**: Engulfing
- **Xám**: Doji
**Ưu Điểm**
**Dành cho Nhà Giao Dịch**
- **Tất cả trong một**: Nhiều mẫu trong một chỉ báo duy nhất
- **Tùy chỉnh**: Tinh chỉnh từng mẫu
- **Trực quan rõ ràng**: Mã màu trực quan dễ hiểu
- **Lọc**: Ngăn ngừa quá tải tín hiệu
**Trường Hợp Sử Dụng**
**1. Phân tích nhanh**
- Xác định xu hướng hiện tại
- Kiểm tra FVG và khoảng trống gần đây
- Phát hiện mẫu đảo chiều
**2. Xác nhận vào lệnh**
- Kết hợp nhiều mẫu để tăng xác suất
- Kiểm tra sự phù hợp với xu hướng
- Xem xét độ mạnh tín hiệu
**3. Quản lý rủi ro**
- Xác định các mức hỗ trợ/kháng cự gần đó
- Sử dụng FVG làm khu vực quan tâm
- Xem xét khoảng cách tín hiệu
**Hạn Chế**
**Phụ Thuộc**
- **Thị trường biến động**: Có thể tạo nhiều tín hiệu
- **Khung thời gian**: Cần điều chỉnh theo từng khung
- **Tài sản**: Hành vi khác nhau theo cặp tiền tệ
**Lưu Ý**
- **Không dự đoán**: Mẫu quá khứ ≠ đảm bảo tương lai
- **Cần xác nhận**: Luôn xác nhận bằng phân tích bổ sung
- **Tín hiệu sai**: Bộ lọc giảm nhưng không loại bỏ hoàn toàn
**Khuyến Nghị Sử Dụng**
**Cài Đặt Ban Đầu**
1. Bắt đầu với `Lọc Thông Minh = true`
2. Điều chỉnh `Độ Mạnh Tín Hiệu Tối Thiểu` theo phong cách của bạn
3. Sử dụng `Khoảng cách tín hiệu` để tránh quá tải
4. Tùy chỉnh màu sắc để hiển thị tốt hơn
**Kết Hợp Hiệu Quả**
- **Xu hướng + FVG**: Sự kết hợp mạnh mẽ
- **Inside bar + Mức quan trọng**: Khu vực vào lệnh tốt
- **Pin bar + Engulfing**: Xác nhận đảo chiều
- **123 + Xu hướng**: Tiếp tục có khả năng
**Giám sát**
- Kiểm tra nhật ký trong bảng điều khiển định kỳ
- Điều chỉnh tham số theo thị trường
- Sử dụng kết hợp với các chỉ báo khác
Chỉ báo này là công cụ hoàn chỉnh cho các nhà giao dịch tìm kiếm phân tích kỹ thuật toàn diện tập trung vào hành động giá và các mẫu trực quan, cung cấp sự linh hoạt tối đa trong việc tùy chỉnh và lọc tín hiệu.
**⚠️ TỪ CHỐI TRÁCH NHIỆM QUAN TRỌNG**
Chỉ báo này là CÔNG CỤ PHÂN TÍCH KỸ THUẬT. Các tín hiệu tạo ra là ĐỀ XUẤT dựa trên thuật toán, KHÔNG phải khuyến nghị đầu tư. Giao dịch có rủi ro mất vốn đáng kể. Hiệu suất quá khứ không đảm bảo kết quả tương lai. Nhà giao dịch chịu TRÁCH NHIỆM TOÀN BỘ cho mọi quyết định giao dịch. Luôn sử dụng quản lý rủi ro thích hợp và thử nghiệm trên tài khoản demo trước khi giao dịch thực.


