
Levels
Chỉ báo
175 lượt tải
Phiên bản 1.0, Jan 2026
Windows, Mac
Mô tả
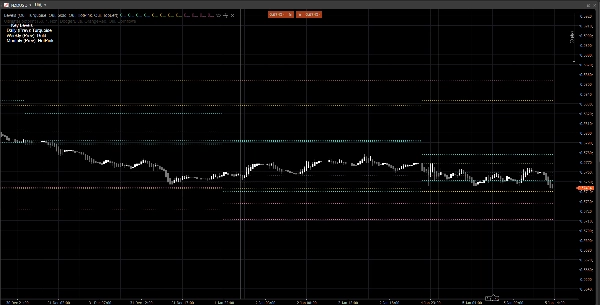
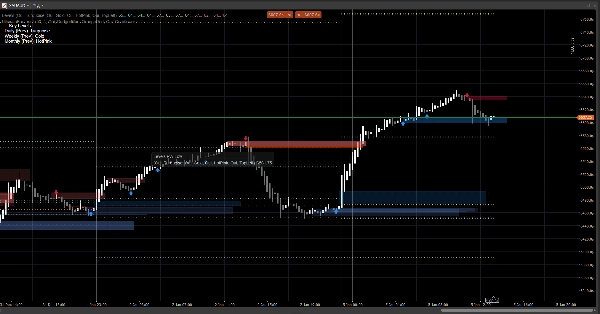
Price Action Zones là một chỉ báo nhẹ, không gây nhiễu, vẽ các mức chính của Ngày, Tuần và Tháng trước đó trực tiếp trên biểu đồ của bạn.
Nó hiển thị:
- Ngày trước đó: Cao / Thấp / Mở / Đóng
- Tuần trước đó: Cao / Thấp / Mở / Đóng
- Tháng trước đó: Cao / Thấp / Mở / Đóng
Những mức này được sử dụng rộng rãi như vùng phản ứng, tham chiếu thanh khoản, và mỏ neo ngữ cảnh cho cấu trúc thị trường, điểm vào, mục tiêu và vị trí rủi ro.
Tại sao nó hữu ích
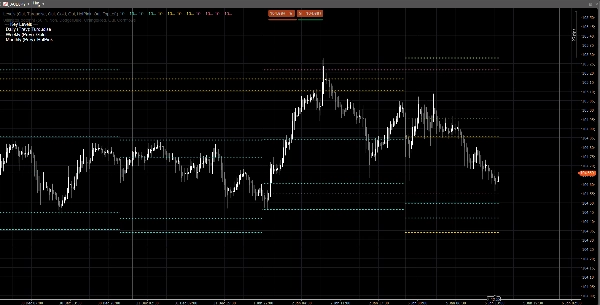
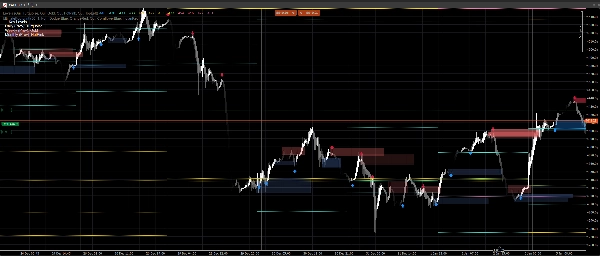
- Xem ngay các mức tham chiếu khung thời gian cao hơn mà không cần chuyển đổi biểu đồ
- Giúp bạn định khung hành động giá trong ngày quanh PDH/PDL, PWH/PWL, PMH/PML
- Hình ảnh sạch sẽ: các mức giữ nguyên trong phiên/tuần/tháng hiện tại
- Hoạt động trên bất kỳ ký hiệu và khung thời gian nào
Tùy chỉnh
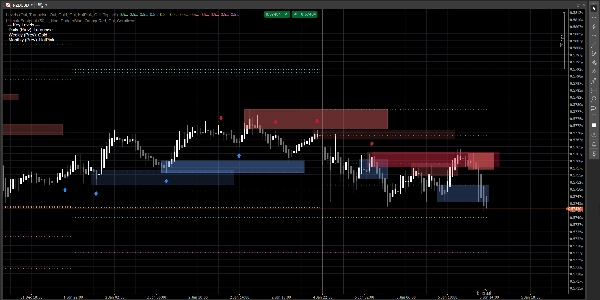
Bạn có thể bật tắt độc lập từng khung thời gian:
- Hiển thị Ngày / Tuần / Tháng
- Đặt màu sắc tùy chỉnh cho từng nhóm
- Bật chú giải đơn giản, với vị trí góc có thể chọn
Ghi chú kỹ thuật
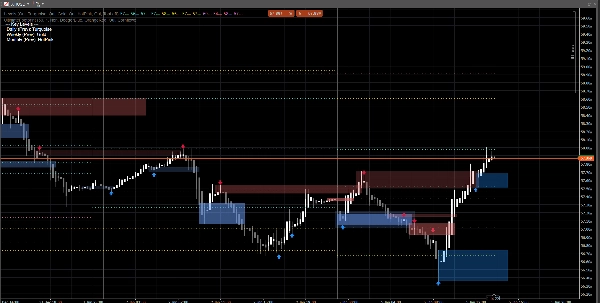
- Các mức được tính toán sử dụng nến đã hoàn thành trước đó của Ngày/Tuần/Tháng (không phải nến đang hình thành hiện tại).
- Điều này ngăn chặn việc vẽ lại và giữ các mức ổn định trong suốt phiên.
Tuyên bố từ chối trách nhiệm
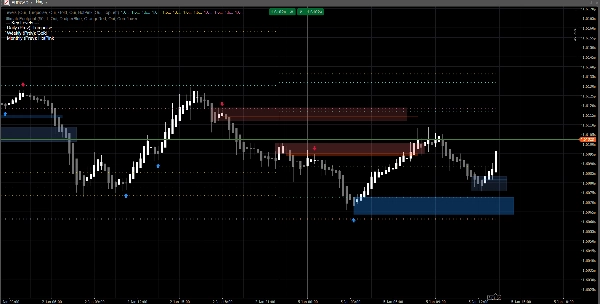
Chỉ báo này được cung cấp chỉ để hỗ trợ biểu đồ và quyết định. Nó không tạo ra tín hiệu mua/bán và không phải là lời khuyên tài chính. Luôn quản lý rủi ro và xác thực trên dữ liệu của riêng bạn.
Các tín hiệu trên biểu đồ được tạo ra bởi chỉ báo Ultimate Footprint có trên hồ sơ của tôi.
Tóm tắt
Hồ sơ chỉ báo
Đánh giá của khách hàng
0.0
Đánh giá: 0
Đánh giá của khách hàng
Sản phẩm này chưa có đánh giá nào. Bạn đã dùng thử chưa? Hãy là người đầu tiên chia sẻ với mọi người!
Thảo luận
Câu hỏi thường gặp
Prop
Forex
Indices
Commodities
Crypto
Stocks
Các sản phẩm có sẵn trên cTrader Store, bao gồm bot giao dịch, chỉ báo và plugin, được cung cấp bởi các nhà phát triển bên thứ ba và chỉ nhằm mục đích cung cấp thông tin và tiếp cận kỹ thuật. cTrader Store không phải là nhà môi giới và không cung cấp lời khuyên đầu tư, khuyến nghị cá nhân hay bất kỳ đảm bảo nào về hiệu suất trong tương lai.


Giá
Kể từ 23/07/2025
6.91M
Khối lượng đã giao dịch
27.63K
Pip đạt được
877
Cài đặt miễn phí