Mô tả
🚀 Volume Profile Pro cho cTrader
Mở khóa cấu trúc thực sự đằng sau hành động giá với Volume Profile Pro, một chỉ báo Volume-by-Price mạnh mẽ và hoàn toàn tùy chỉnh được thiết kế đặc biệt cho các nhà giao dịch chuyên nghiệp trên cTrader.
Công cụ tiên tiến này trực quan hóa các hồ sơ khối lượng riêng lẻ theo từng khoảng thời gian đã chọn, cho phép bạn thấy chính xác nơi hoạt động của các tổ chức tập trung — trực tiếp bên trong biểu đồ của bạn.
🔎 Nó làm gì
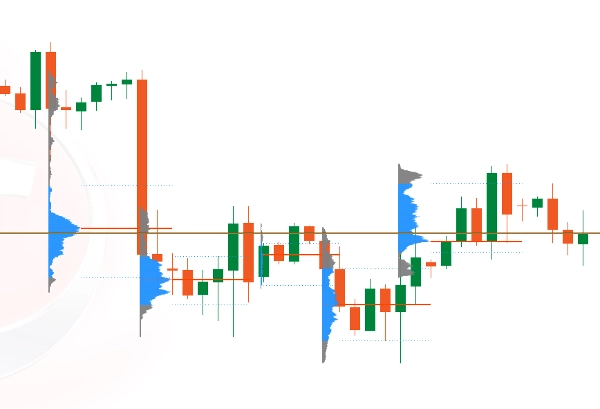
Volume Profile Pro tính toán và hiển thị phân phối khối lượng theo phạm vi cố định cho mỗi khoảng thời gian đã hoàn thành (H1, M15, D1, v.v.), được vẽ trực tiếp trên trục giá để phân tích cấu trúc chính xác.
Mỗi hồ sơ:
- Được vẽ riêng biệt cho từng khoảng thời gian
- Sử dụng phạm vi giá cố định nhất quán
- Hiển thị phân phối khối lượng theo mức giá
- Làm nổi bật các mức quan trọng của tổ chức
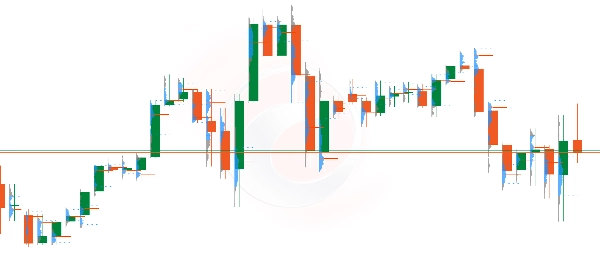
Các hồ sơ được đặt gọn gàng về bên trái của mỗi cây nến, đảm bảo nhận diện cấu trúc rõ ràng mà không cản trở hành động giá.
⚡ Tính năng chính
✔ Hồ sơ khối lượng riêng biệt theo từng khoảng thời gian
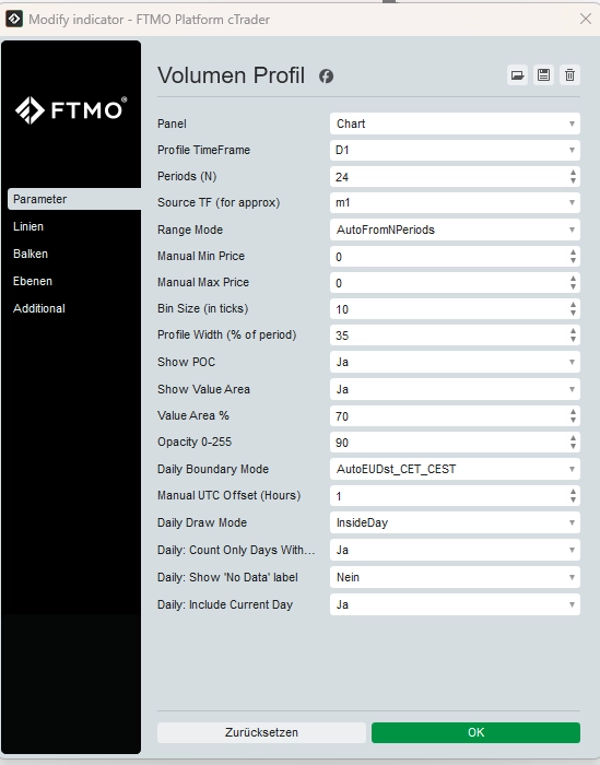
✔ Thời gian hồ sơ có thể chọn (M15, H1, H4, D1, v.v.)
✔ Phạm vi giá cố định (tự động hoặc thủ công)
✔ Làm nổi bật Điểm Kiểm Soát (POC)
✔ Giá trị Khu vực Cao (VAH) & Giá trị Khu vực Thấp (VAL)
✔ Hiển thị mượt mà không nhấp nháy biểu đồ
✔ Tối ưu hóa hoàn toàn cho hiệu suất
✔ Thiết kế cho môi trường CFD và Khối lượng Tick
📊 Tại sao các nhà giao dịch sử dụng nó
- Xác định các vùng tích lũy & phân phối của tổ chức
- Phát hiện các mức phản ứng có xác suất cao
- Xác nhận sức mạnh phá vỡ
- Tinh chỉnh điểm vào trong các phạm vi hợp nhất
- Căn chỉnh cấu trúc khối lượng với hành động giá
Dù bạn là scalper, nhà giao dịch trong ngày hay nhà giao dịch swing, Volume Profile Pro mang lại cho bạn lợi thế về cấu trúc.
⚠ Tuyên bố từ chối trách nhiệm quan trọng
Volume Profile là một công cụ phần mềm giao dịch và không cấu thành lời khuyên tài chính hoặc đầu tư.
Giao dịch Forex, CFDs và các công cụ tài chính khác có rủi ro đáng kể và có thể dẫn đến mất vốn.
🎯 Được xây dựng cho sự chính xác. Thiết kế cho các chuyên gia.
Nâng cao phân tích cấu trúc thị trường của bạn và giao dịch với sự rõ ràng, tự tin và kiểm soát.
Tóm tắt
Đánh giá của khách hàng
5 | 100 % | |
4 | 0 % | |
3 | 0 % | |
2 | 0 % | |
1 | 0 % |