
KST Momentum Heatwave — Превратите импульс в температуру рынка (на графике)
✅ Современный движок KST с оптимизированными настройками по умолчанию (10/15/20/30 + 10/10/10/15, Сигнал 9)
✅ Наложение истинной цены — KST + Сигнал проецируются прямо на график вокруг базовой EMA
✅ 4 визуальных режима: Pro Smooth / Classic / Raw Heat / Two Tier
✅ Тепловая карта импульса + свечения для мгновенной визуализации силы
✅ Нормализованная сила импульса для согласованности между символами и таймфреймами
✅ Система гистерезиса против шума для фильтрации шума на боковых рынках
Это не традиционный осциллятор.
KST Momentum Heatwave преобразует классический индикатор Know Sure Thing (KST) в визуальную систему температуры импульса, встроенную прямо в ваш график.
Вместо того чтобы смотреть на осциллятор под графиком, импульс становится динамическим слоем поверх цены — показывая направление, силу и жизненный цикл импульса таким образом, который можно интерпретировать мгновенно.
Что делает индикатор и для чего он предназначен
KST Momentum Heatwave преобразует данные импульса в визуальную температурную карту рыночного давления.
Традиционные осцилляторы требуют от трейдеров постоянного переключения внимания между графиком цены и отдельным окном индикатора.
Этот индикатор устраняет это неудобство, проецируя импульс прямо на сам график цены.
В результате получается более чистый рабочий процесс, где вы сразу видите:
- когда импульс ускоряется
- когда тренд сильный и доминирующий
- когда импульс охлаждается
- когда рынок входит в низкоэнергетический боковой тренд
Он предназначен для трейдеров, которые хотят быстро определить:
- силу тренда
- возможности продолжения импульса
- истощение импульса
- смены режима
Вместо того чтобы гадать, есть ли у движения сила, KST Momentum Heatwave делает это давление видимым.
Что он отображает на графике и как это читать
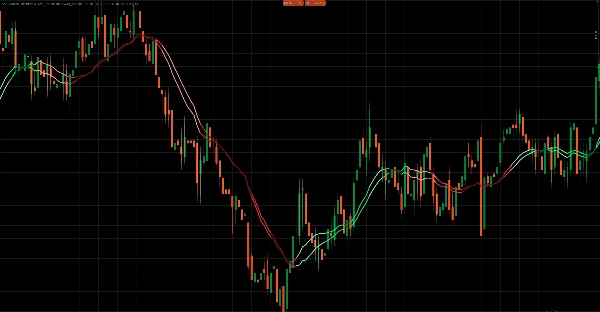
Индикатор отображает две линии импульса прямо на графике цены вместе с визуальным тепловым слоем.
1. Линия KST — Ядро импульса
Основная линия импульса, рассчитанная из четырех взвешенных компонентов ROC.
Интерпретация:
- KST выше Сигнала → бычий импульс
- KST ниже Сигнала → медвежий импульс
Расстояние между двумя линиями указывает на интенсивность импульса.
2. Линия Сигнала — Триггер импульса
Сглаженное скользящее среднее линии KST.
Она выступает в роли линии триггера импульса.
- Пересечения между KST и Сигналом часто указывают на смены или ускорения импульса.
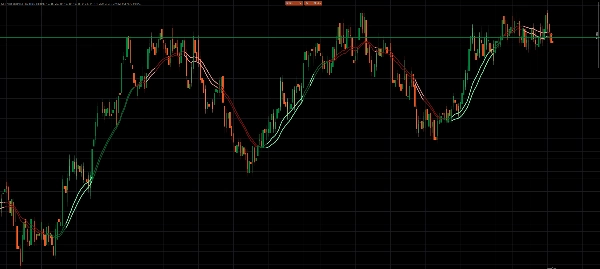
3. Тепловой слой импульса
Индикатор преобразует расстояние между KST и Сигналом в нормализованное значение силы от 0 до 1.
Это значение управляет интенсивностью цвета и визуализацией тепловой карты.
Интерпретация:
- Яркие/светлые цвета → сильный импульс
- Обычные цвета → стабильное давление тренда
- Темные цвета → ослабление импульса
- Блеклые цвета → возможное замедление или переход
Опциональные эффекты тепловой карты и свечения окрашивают сами свечи, позволяя трейдерам мгновенно видеть, когда рынок «нагревается».
4. Слой проекции цены
Вместо отображения сырых значений осциллятора индикатор проецирует импульс на цену с использованием:
- базовой EMA
- масштабированной по ATR амплитуды
Это сохраняет пропорциональность наложения на график и обеспечивает читаемость индикатора на разных рынках и таймфреймах.
Визуальные режимы и поведение
KST Momentum Heatwave включает четыре визуальных стиля, которые меняют интерпретацию импульса.
Pro Smooth
Самый продвинутый режим.
Особенности:
- окраска импульса на основе жизненного цикла
- фильтрация гистерезиса
- требования подтверждения перед сменой направления
Это значительно снижает шум во время боковых или флуктуационных рынков.
Classic
Использует окраску жизненного цикла без фильтрации гистерезиса.
Результат:
- быстрее реакции импульса
- слегка более чувствителен к колебаниям рынка
Лучше всего подходит для интрадей и свинг-трейдинга.
Raw Heat
Сфокусирован исключительно на абсолютной силе импульса.
Импульс классифицируется на три уровня:
- сильный
- средний
- слабый
Этот режим идеален для трейдеров, которые хотят чистое чтение силы импульса.
Two Tier
Упрощенный режим интерпретации.
- KST выше/ниже Сигнала определяет направление
- порог силы определяет сильный или слабый импульс
Предназначен для трейдеров, предпочитающих минимальную визуальную сложность.
Как использовать KST Momentum Heatwave
Шаг 1 — Выберите визуальный режим
Используйте режим, соответствующий вашему стилю торговли:
- Pro Smooth → самые чистые сигналы на шумных рынках
- Classic → более быстрые реакции
- Raw Heat → фокус на силе импульса
- Two Tier → простая интерпретация сильного и слабого импульса
Шаг 2 — Определите режим импульса
Ищите доминирующее поведение цвета:
- Доминируют бычьи цвета → лонговый уклон
- Доминируют медвежьи цвета → шортовый уклон
- Темные блеклые цвета → ослабление импульса
- Частые смены цвета → вероятные флетовые условия
Шаг 3 — Используйте импульс для тайминга сделок
Типичные случаи использования включают:
Продолжение тренда
Входите во время откатов, когда режим импульса сохраняется, а сила остается высокой.
Истощение импульса
Снижайте экспозицию, когда цвета становятся темнее и сила снижается.
Разворот импульса
Следите за сменами KST/Сигнала в сочетании с ростом силы.
Пример рекомендуемой настройки
Сбалансированная конфигурация для большинства рынков:
Пресет: Swing_Classic
Визуальный режим: Pro Smooth
Базовая EMA: 34
Период ATR: 14
Амплитуда ATR: 1.40
Нормализация Lookback: 200
Тепловая карта: Включена
Свечение: Включено
Рекомендуемые рынки и таймфреймы
Поскольку индикатор использует масштабирование ATR и нормализованную силу, он хорошо адаптируется к большинству рынков.
Особенно хорошо работает на:
Форекс
- M5 – H1 для внутридневной торговли
- H1 – H4 для свинг-трейдинга
Индексы
- M1 – M15 для скальпинга импульса
- M15 – H1 для структурированной торговли трендом
Криптовалюты
- M5 – H1 (рекомендуется Pro Smooth)
- H1 – H4 для трендовых условий
Товары
- M15 – H4
Нижние таймфреймы больше всего выигрывают от фильтрации Pro Smooth.
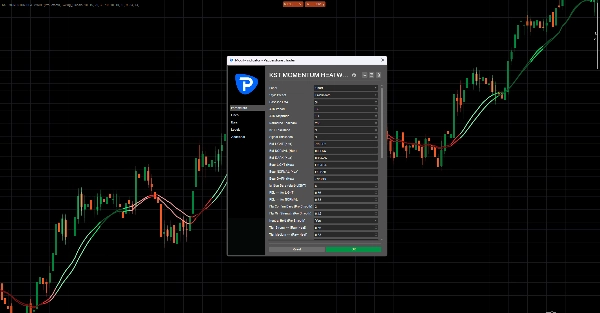
Ключевые параметры и что они контролируют
Система пресетов
Пресеты Scalp_Clean, Swing_Classic, Smooth и Aggressive настраивают внутреннюю конфигурацию KST.
Режим Custom позволяет полный ручной контроль.
Нормализация импульса
Normalize Lookback
Контролирует историческое окно, используемое для масштабирования силы импульса.
Более высокие значения дают более сглаженные показания.
Проекция наложения
Baseline EMA
Определяет опорную линию, используемую для проекции наложения импульса.
ATR Amplitude
Контролирует, насколько далеко наложение расширяется от базовой линии.
Контроль против шума (Pro Smooth)
Flip Confirm Bars
Количество баров, необходимых для подтверждения смены режима.
Flip Min Strength
Минимальная сила импульса, необходимая для принятия смены.
Neutral Hold
Помогает стабилизировать режим при слабом импульсе.
Визуализация тепла и свечения
Контролирует, насколько сильно тепловая карта реагирует на силу импульса.
Параметры включают:
- Heat Width
- Heat Alpha
- Heat Gamma
- Glow Strength
Управление производительностью
Keep Bars
Ограничивает количество визуальных объектов на графике, чтобы индикатор работал плавно.
Важные заметки
Интенсивность объектов на графике
Эффекты тепловой карты и свечения рисуют множество объектов.
Если производительность замедляется:
- уменьшите KeepBars
- уменьшите Heat Width
- отключите Свечение
Насыщение силы
Экстремальные всплески волатильности могут быстро довести силу до максимума.
Если это происходит:
- увеличьте Normalize Lookback
- переключитесь в режим Pro Smooth
Лучше всего использовать с структурой
KST Momentum Heatwave разработан как слой режима импульса, а не как самостоятельный генератор входов.
Для лучших результатов комбинируйте его с:
- уровнями поддержки и сопротивления
- структурой рынка
- зонами ликвидности
- анализом тренда


![Логотип продукта "Wyckoff Toolkit [Iridio Capital]"](https://cdn.ctrader.com/image/webp/8acfe6a1-6a8e-4578-9367-9df3af2b1801_27763)


![Логотип продукта "Smart Money Concepts (SMC) [Iridio Capital]"](https://cdn.ctrader.com/image/webp/28b69fd1-ef54-4bed-9487-07e78e883be4_40934)
