Bộ dao động Kênh Chu kỳ Hurst Nâng cao — Mô tả chỉ báo
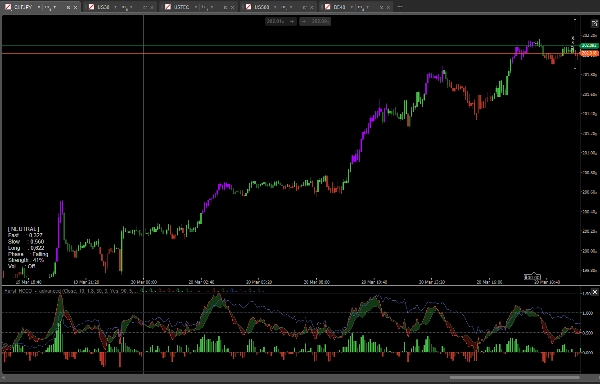
Bộ dao động Kênh Chu kỳ Hurst Nâng cao là một chỉ báo động lượng đa chu kỳ chuyên nghiệp dành cho cTrader dựa trên các nguyên lý của lý thuyết chu kỳ Hurst. Thay vì đo động lượng giá thô, nó định vị giá hiện tại trong các kênh chu kỳ được tính toán động, giúp các nhà giao dịch có cái nhìn chuẩn hóa về vị trí của giá trong chuyển động chu kỳ tự nhiên của nó.
Ba lớp Chu kỳ
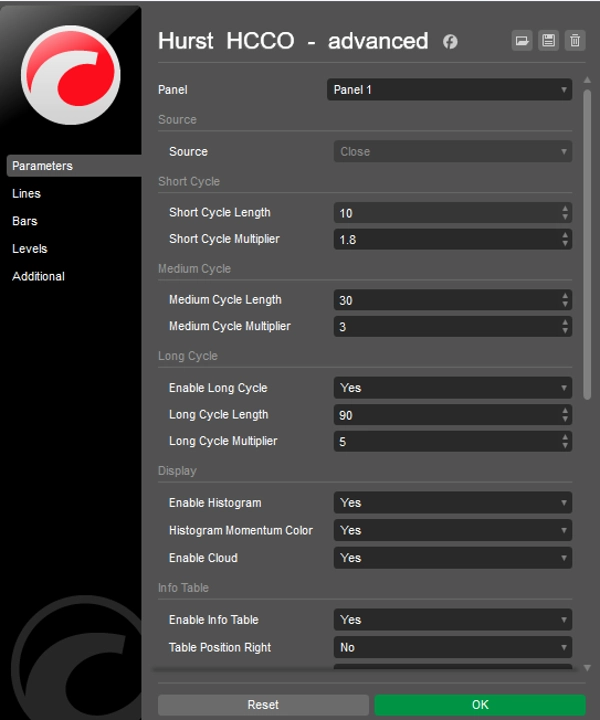
Chỉ báo tính toán ba kênh chu kỳ độc lập — Ngắn, Trung bình và Dài — mỗi kênh được xây dựng từ trung bình động hàm mũ đặt ở giữa một bao ATR. Chu kỳ Ngắn và Trung bình điều khiển bộ dao động chính, trong khi chu kỳ Dài tùy chọn cung cấp bối cảnh thị trường rộng hơn. Tất cả độ dài chu kỳ và hệ số nhân ATR đều có thể cấu hình hoàn toàn.
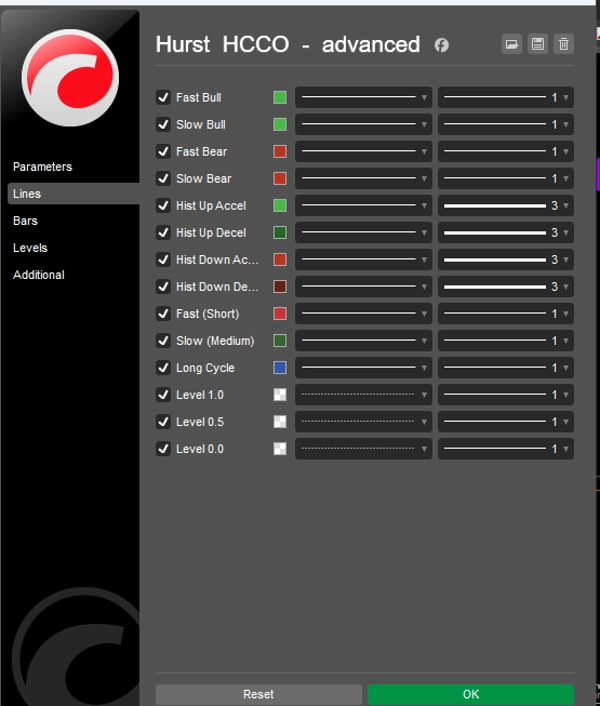
Đường dao động Nhanh và Chậm
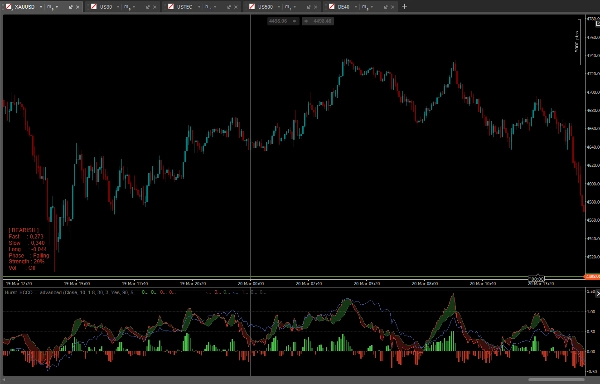
Đường Nhanh cho thấy vị trí giá hiện tại trong kênh chu kỳ Trung bình — giá trị trên 0,5 nghĩa là giá nằm ở nửa trên của chu kỳ, dưới 0,5 nghĩa là nửa dưới. Đường Chậm đại diện cho điểm giữa của kênh chu kỳ Ngắn so với chu kỳ Trung bình, đóng vai trò như một tham chiếu mượt mà hơn. Cả hai cùng tạo thành một bộ dao động hai đường tương tự về cấu trúc với MACD nhưng dựa trên hình học chu kỳ.
Đám mây Chu kỳ
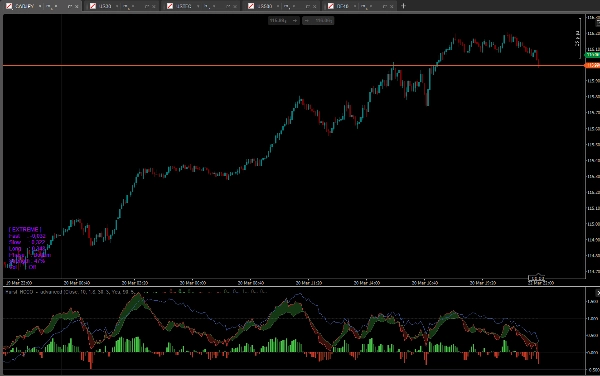
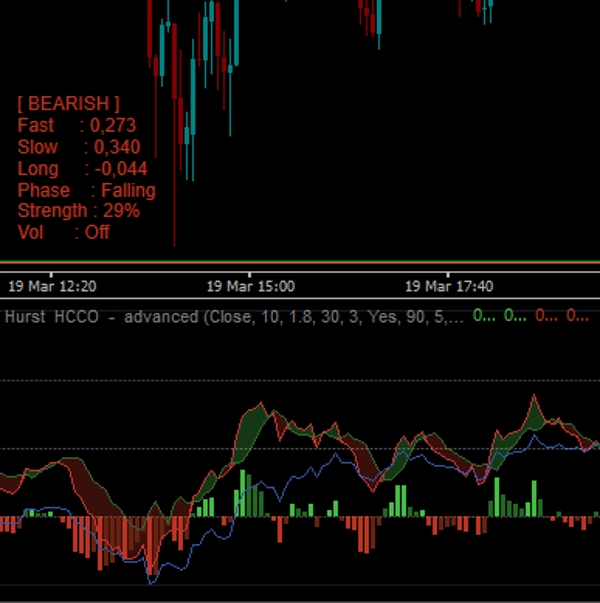
Một đám mây tùy chọn lấp đầy khu vực giữa hai đường Nhanh và Chậm. Đám mây màu xanh lá hình thành khi Nhanh nằm trên Chậm (xu hướng chu kỳ tăng), đám mây màu đỏ khi Nhanh nằm dưới Chậm (xu hướng chu kỳ giảm). Đám mây giúp mối quan hệ giữa hai lớp chu kỳ trở nên dễ đọc ngay lập tức.
Biểu đồ động lượng
Biểu đồ thể hiện sự khác biệt giữa hai đường Nhanh và Chậm với mã màu động lượng bốn màu — tăng tốc tăng, giảm tốc tăng, tăng tốc giảm, giảm tốc giảm. Điều này giúp dễ dàng nhận biết không chỉ hướng đi mà còn chu kỳ có đang tăng hay giảm năng lượng.
Phát hiện Pha Chu kỳ
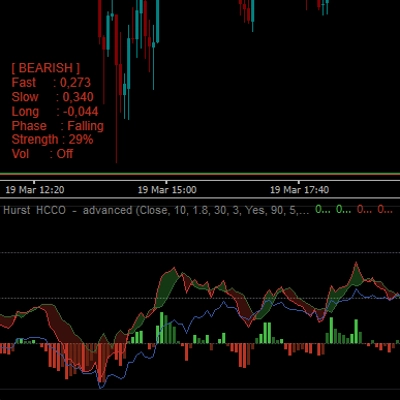
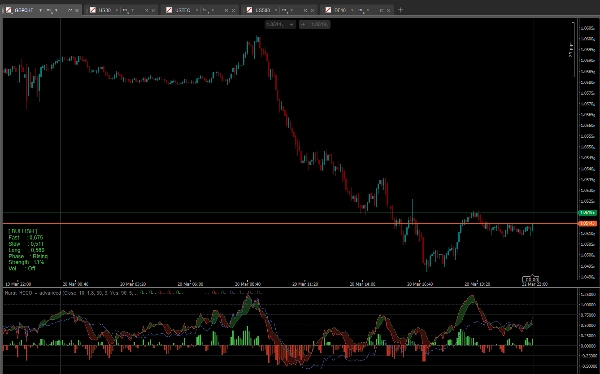
Bảng thông tin hiển thị pha hiện tại của chu kỳ: Đáy, Trước Đáy, Phục hồi, Tăng, Yếu đi, Sau Đỉnh, Đỉnh. Nhãn này được lấy trực tiếp từ giá trị bộ dao động Nhanh và hướng của nó, cung cấp cho nhà giao dịch một cách đọc rõ ràng về vị trí thị trường trong chu kỳ.
Độ mạnh Xu hướng
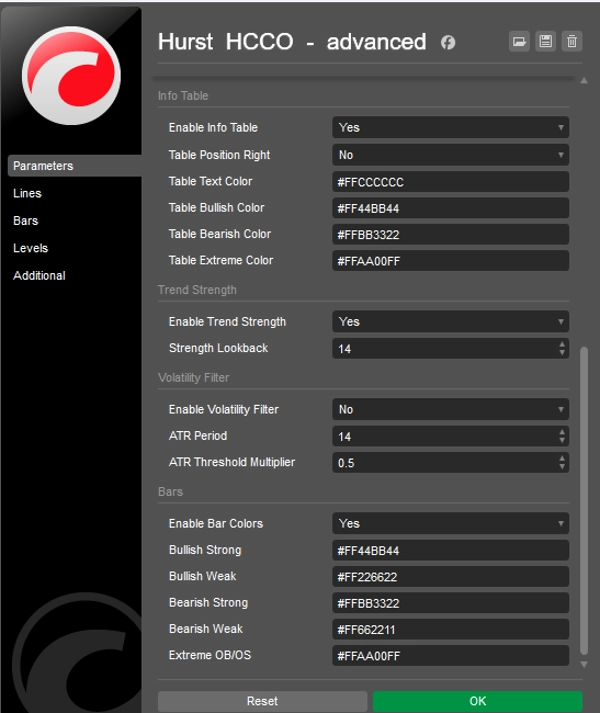
Một khoảng nhìn lại có thể cấu hình tính điểm độ mạnh xu hướng chuẩn hóa dựa trên mức độ lệch của đường Nhanh so với điểm giữa 0,5. Kết quả được hiển thị dưới dạng phần trăm trong bảng thông tin.
Bộ lọc Biến động
Một bộ lọc biến động dựa trên ATR tùy chọn làm mờ các thanh biểu đồ và màu sắc thanh khi biến động thị trường giảm xuống dưới ngưỡng có thể cấu hình, ngăn bộ dao động tạo ra các tín hiệu sai lệch trong điều kiện thị trường phẳng hoặc dao động mạnh.
Bảng Thông tin
Một bảng nhỏ trên biểu đồ hiển thị trạng thái thị trường hiện tại (Tăng, Giảm, Trung lập, Cực đoan), giá trị bộ dao động Nhanh, Chậm và Dài, pha chu kỳ, phần trăm độ mạnh xu hướng và trạng thái bộ lọc biến động. Vị trí và tất cả màu sắc đều có thể cấu hình.
Tô màu Thanh
Khi bật, nến trên biểu đồ được tô màu dựa trên trạng thái bộ dao động — tăng mạnh, tăng yếu, giảm yếu, giảm mạnh và quá mua/quá bán cực đoan. Các giá trị cực đoan xảy ra khi đường Nhanh di chuyển ra ngoài phạm vi 0.0–1.0, báo hiệu một sự bứt phá giá vượt ra ngoài kênh chu kỳ.
Tóm tắt các Tính năng Chính
- Ba lớp chu kỳ có thể cấu hình dựa trên lý thuyết chu kỳ Hurst
- Bộ dao động kép Nhanh/Chậm chuẩn hóa theo vị trí kênh chu kỳ
- Đám mây chu kỳ giữa hai đường Nhanh và Chậm
- Biểu đồ động lượng bốn màu
- Phát hiện pha chu kỳ tự động với nhãn ngôn ngữ đơn giản
- Phần trăm độ mạnh xu hướng theo thời gian thực
- Bộ lọc biến động dựa trên ATR
- Bảng thông tin trên biểu đồ với phân tích đầy đủ trạng thái thị trường
- Tùy chọn tô màu nến
- Tất cả màu sắc có thể tùy chỉnh hoàn toàn với hỗ trợ kênh alpha
- Không vẽ lại
5 | 100 % | |
4 | 0 % | |
3 | 0 % | |
2 | 0 % | |
1 | 0 % |