Mô tả
Mô tả
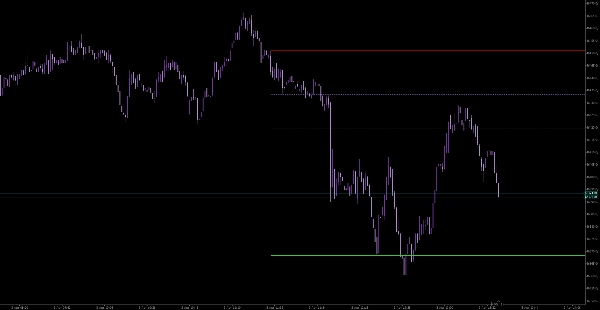
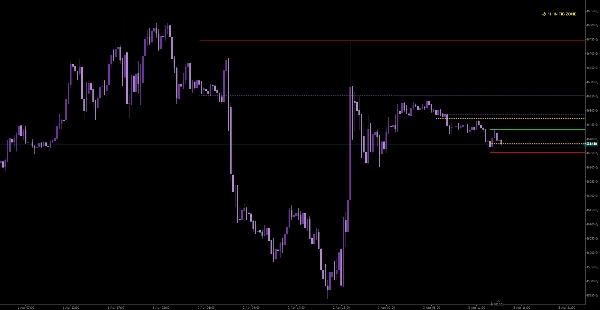
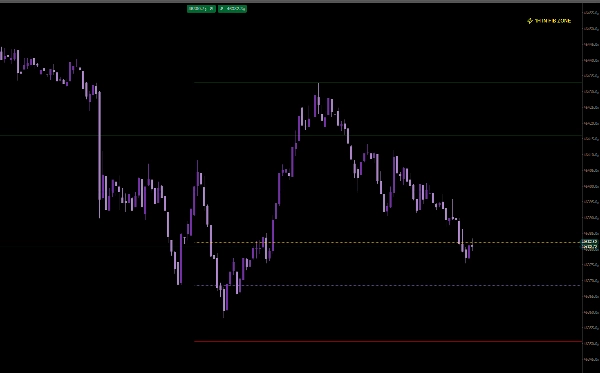
Tự động vẽ các mức thoái lui Fibonacci sử dụng cây nến trước đó từ bất kỳ khung thời gian đã chọn nào — trực tiếp trên biểu đồ của bạn. Không cần vẽ thủ công.
Cách hoạt động
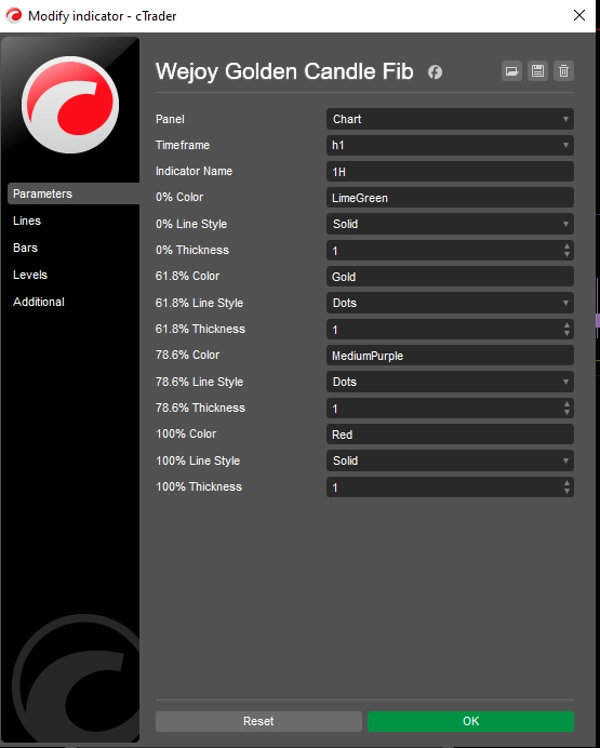
Chỉ báo đọc cây nến đóng cuối cùng từ khung thời gian bạn chọn (1H, 4H, Daily, v.v.) và vẽ bốn mức Fibonacci chính dưới dạng tia mở rộng:
- 0% — Đỉnh nến (tăng giá) hoặc đáy nến (giảm giá); điểm xuất phát động lượng
- 61.8% — Vùng thoái lui ban đầu (rút lui nhẹ)
- 78.6% — Vùng thoái lui sâu (khu vực vào lệnh chính xác)
- 100% — Thoái lui hoàn toàn; đầu đối diện của cây nến
Phát hiện vùng thông minh
Phạm vi 61.8%–78.6% được xem là vùng thoái lui cao cấp.
Khi giá vào vùng này, chỉ báo sẽ kích hoạt:
- Cảnh báo trên màn hình theo thời gian thực
- Thông báo qua email với hướng đi, khung thời gian, giá và chi tiết vùng
Hỗ trợ đa phiên bản
Chạy nhiều phiên bản trên cùng một biểu đồ (ví dụ: 1H, 4H, Daily) mà không bị chồng chéo hoặc xung đột. Mỗi phiên bản hoạt động độc lập với một định danh riêng biệt.
Tùy chỉnh
Tất cả các mức Fibonacci đều có thể tùy chỉnh hoàn toàn:
- Màu sắc
- Kiểu đường (liền, chấm, gạch ngang)
- Độ dày đường
Phù hợp nhất với
XAUUSD (Vàng), nhưng tương thích với tất cả các công cụ và khung thời gian.
Thiết kế cho
Các nhà giao dịch tập trung vào việc vào lệnh chính xác, chờ giá thoái lui vào vùng vàng trước khi thực hiện giao dịch.