Mô tả
Hồ sơ Thanh khoản & Hấp thụ Cá voi
Theo dõi tiền tổ chức, phân tích luồng lệnh và phát hiện các vùng đảo chiều với độ chính xác theo thể tích
The Whale Liquidity & Absorption Profile không phải là hồ sơ khối lượng truyền thống của bạn. Đây là một bộ phân tích cấu trúc vi mô thị trường phân tích từng giao dịch để cho bạn thấy không chỉ nơi khối lượng được giao dịch, mà còn ai đã giao dịch nó (tổ chức so với bán lẻ) và cách giá tương tác tại các mức đó (sự hung hăng so với sự hấp thụ).
Nó có một động cơ kết xuất tối ưu hóa chiếu tất cả dữ liệu sang bên phải của giá hiện tại, giữ cho biểu đồ của bạn hoàn toàn sạch sẽ và không bị trễ.
Các tính năng chính
- Bộ lọc sức mạnh (Chỉ dành cho Cá voi): Sử dụng thuật toán phần trăm (ví dụ, top 97%) để phân tách khối lượng tổ chức ("Mạnh") khỏi khối lượng bán lẻ ("Yếu"). Bạn có thể bật chế độ "Chỉ Mạnh" để chỉ theo dõi dấu chân của tiền thông minh.
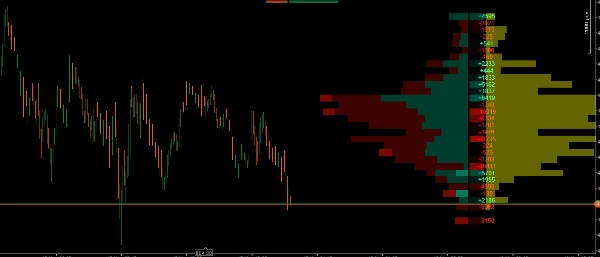
- Hồ sơ khối lượng xếp chồng: Hiển thị trực quan phân phối khối lượng tăng và giảm theo từng mức giá, giúp dễ dàng xác định Điểm Kiểm soát (POC) và Các nút khối lượng cao/thấp (HVN/LVN).
- Phát hiện khu vực giá trị tự động: Làm nổi bật các mức giá nơi phần trăm khối lượng cao nhất đã được giao dịch (mặc định 70%), làm mờ các vùng ngoài để dễ dàng đọc bối cảnh thị trường chỉ trong nháy mắt.
- Hồ sơ Delta (Bản đồ nhiệt): Tính toán chính xác sự khác biệt giữa mua và bán thị trường tại mỗi mức giá. Bao gồm giá trị số và bản đồ nhiệt trực quan để nhanh chóng phát hiện ai đang kiểm soát một cách hung hăng.
- Hồ sơ hấp thụ (Vùng màu vàng): Đo lường khối lượng bị giữ lại cụ thể trong các đuôi nến. Điều này cho phép bạn nhìn thấy chính xác nơi tiền thông minh đang thụ động hấp thụ thanh khoản từ các nhà giao dịch bán lẻ bị mắc kẹt.
- Hiệu suất tối ưu: Các phép tính thể tích nặng chỉ được xử lý trên cây nến mới nhất, đảm bảo nền tảng cTrader của bạn chạy mượt mà và hiệu quả, ngay cả trên các khung thời gian thấp hơn.
Làm thế nào để sử dụng chỉ báo này trong giao dịch của bạn?
Chỉ báo này cung cấp 3 lớp xác nhận cho các giao dịch của bạn. Dưới đây là cách kết hợp chúng một cách hiệu quả:
1. Xác định bối cảnh với Hồ sơ Khối lượng & Khu vực Giá trị
- Sử dụng hồ sơ khối lượng để xác định nơi chấp nhận giá cao nhất (Khu vực Giá trị và POC).
- Chiến lược: Tìm cơ hội mua ở đáy Khu vực Giá trị (Hỗ trợ) và cơ hội bán ở đỉnh Khu vực Giá trị (Kháng cự).
2. Đánh giá sự hung hăng với Hồ sơ Delta
- Khi giá đạt đến mức quan trọng của bạn (ví dụ, vùng hỗ trợ), hãy nhìn vào cột Delta.
- Chiến lược: Nếu bạn đang tìm mua tại hỗ trợ, bạn muốn thấy Delta dương mạnh (màu xanh lá) ở mức đó, cho thấy người mua đang bước vào một cách hung hăng. Nếu Delta vẫn âm mạnh, người bán vẫn đang chiếm ưu thế.
3. Tìm kích hoạt hoàn hảo với Hồ sơ Hấp thụ (Trung tâm của chỉ báo)
- Đây là nơi công cụ thực sự tỏa sáng. Thường thì thị trường có vẻ như đang giảm mạnh (Delta âm mạnh), nhưng giá lại ngừng giảm. Tại sao? Bởi vì các "cá voi" đang sử dụng lệnh giới hạn để hấp thụ toàn bộ áp lực bán đó.
- Chiến lược (Giao dịch đảo chiều): Nếu bạn thấy giá giảm vào một mức quan trọng và Delta âm (người bán lẻ bị mắc kẹt), nhưng đột nhiên xuất hiện một thanh màu vàng lớn trong Hồ sơ Hấp thụ, điều đó có nghĩa là các tổ chức vừa hấp thụ toàn bộ thanh khoản trong đuôi nến đó. Đây là tín hiệu kích hoạt tối ưu để bạn vào lệnh theo hướng ngược lại!
4. Sử dụng "Bộ lọc sức mạnh" để loại bỏ nhiễu
- Nếu thị trường đang tích lũy và hướng đi không rõ ràng, hãy bật tùy chọn "Chỉ Mạnh". Điều này sẽ ẩn tất cả tiếng ồn bán lẻ không liên quan và cho bạn thấy chính xác nơi các quỹ lớn đang tích lũy hoặc phân phối vị thế của họ.
Tóm tắt
A Delta Profile heatmap calculates the net difference between market buys and sells at each price level, showing buyer or seller aggression. The Absorption Profile identifies volume trapped in candlestick wicks, revealing where institutional traders absorb liquidity from retail participants. The indicator’s optimized engine processes heavy volumetric calculations only on the latest candle, ensuring smooth performance on the cTrader platform.
Traders can use this tool to define market context, evaluate buying or selling aggression, and pinpoint reversal triggers based on absorption patterns. The "Strong Only" mode filters out retail noise during consolidation phases, focusing on institutional accumulation or distribution zones. This indicator supports volume and DOM data visualization to enhance decision-making around key support and resistance levels.
Đánh giá của khách hàng
5 | 100 % | |
4 | 0 % | |
3 | 0 % | |
2 | 0 % | |
1 | 0 % |