Mô tả
Chỉ Báo Giá Trị Đệ Quy Nội Tại
Tổng Quan
Chỉ báo Giá Trị Đệ Quy Nội Tại là một chỉ báo tùy chỉnh sử dụng các phép tính sức mạnh tương đối đệ quy qua nhiều chu kỳ để xác định các xu hướng thị trường nội tại. Nó xác định các mức giá chính nơi sức mạnh xu hướng đạt đến mức quan trọng, cung cấp cái nhìn sâu sắc về khả năng đảo chiều và xác nhận xu hướng. Khái niệm về Giá Trị Đệ Quy Nội Tại dựa trên ý tưởng rằng động lượng thị trường và sức mạnh xu hướng có thể được tinh chỉnh đệ quy bằng cách áp dụng nhiều lớp phân tích hành động giá. Phương pháp đệ quy này giúp xác định các điều kiện tăng và giảm sâu sắc mà các chỉ báo dựa trên giá truyền thống có thể bỏ qua.
Khu Vực Giao Dịch Tăng & Giảm
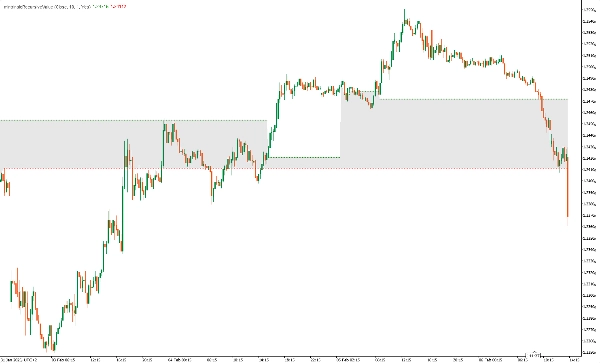
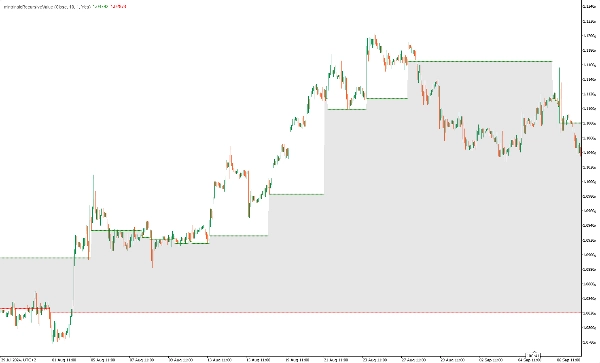
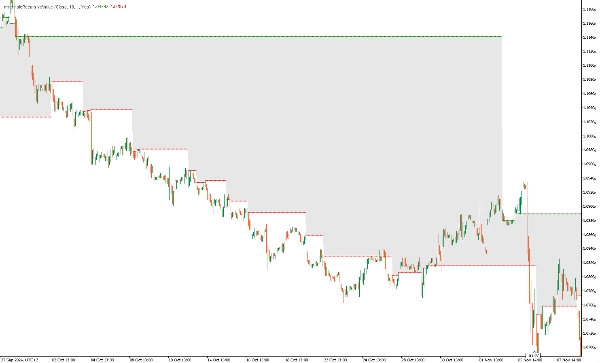
- Khu Vực Giao Dịch Tăng: Khu vực này hình thành khi giá trị đệ quy nội tại xác nhận sức mạnh tăng bền vững. Nó xảy ra khi tất cả các phép tính sức mạnh tương đối đệ quy cho thấy giá trị duy trì trên mức cân bằng, gợi ý động lượng tăng mạnh. Khu vực giao dịch tăng giúp các nhà giao dịch xác định các điểm vào lệnh mua tiềm năng và các vùng hỗ trợ động nơi giá có thể tiếp tục tăng.
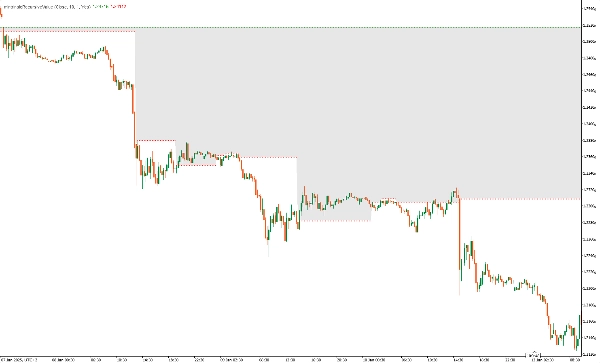
- Khu Vực Giao Dịch Giảm: Khu vực này được thiết lập khi giá trị đệ quy nội tại xác định sức mạnh giảm liên tục. Khi tất cả các giá trị sức mạnh tương đối đệ quy nằm dưới mức cân bằng, nó báo hiệu một xu hướng giảm đang diễn ra, cung cấp cho nhà giao dịch cơ hội vào lệnh bán và xác định các mức kháng cự động nơi giá có thể tiếp tục giảm.
Kết Quả Chỉ Báo
- outIntrinsicRecursiveLong : Hiển thị mức dài nội tại khi phát hiện sức mạnh tăng.
- outIntrinsicRecursiveShort: Hiển thị mức ngắn nội tại khi phát hiện sức mạnh giảm.
Cách Sử Dụng
- Xác Nhận Xu Hướng: Giúp xác định các xu hướng tăng hoặc giảm mạnh khi tất cả các chu kỳ sức mạnh tương đối đồng thuận.
- Phát Hiện Đảo Chiều: Báo hiệu các điểm quay tiềm năng khi giá trị nội tại thay đổi.
- Mức Hỗ Trợ & Kháng Cự: Các giá trị nội tại đóng vai trò như các mức hỗ trợ và kháng cự động.
Chiến Lược Giao Dịch Ví Dụ
- Vào Lệnh Mua: Vào lệnh mua khi mức dài nội tại được thiết lập và hành động giá xác nhận động lượng tăng, điều này có nghĩa là giá nằm trên giá trị cân bằng (thành phần màu xanh của chỉ báo).
- Vào Lệnh Bán: Vào lệnh bán khi mức ngắn nội tại được thiết lập và hành động giá xác nhận động lượng giảm, điều này có nghĩa là giá nằm dưới giá trị cân bằng (thành phần màu đỏ của chỉ báo).
- Chiến Lược Thoát Lệnh: Sử dụng dừng lỗ theo sau hoặc khi các mức nội tại biến mất để thoát lệnh
Ghi Chú
- Chỉ báo được thiết kế cho các chiến lược theo xu hướng và hoạt động tốt nhất trong các thị trường có xu hướng.
- Nó có thể được kết hợp với các chỉ báo khác như chỉ báo động lượng để xác nhận kích hoạt giao dịch.
Kết Luận
Chỉ báo Giá Trị Đệ Quy Nội Tại là một công cụ mạnh mẽ dành cho các nhà giao dịch muốn nâng cao phân tích xu hướng bằng cách sử dụng các phép tính sức mạnh tương đối đệ quy. Bằng cách xác định các mức giá chính với xu hướng có xác suất cao, chỉ báo này cung cấp những hiểu biết quý giá về hướng đi của thị trường và các cơ hội giao dịch tiềm năng.

![Logo "[Stellar Strategies] Ultimate Trend & Momentum Dashboard"](https://cdn.ctrader.com/image/webp/e9a9c9e9-4b6c-4bc0-9988-4c4768a23b6c_30290)