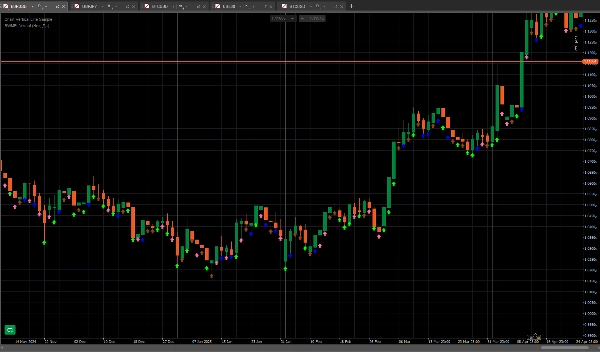
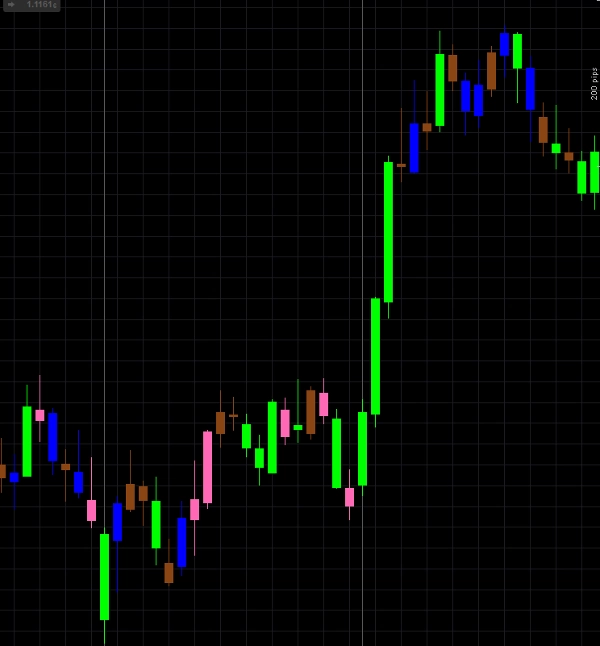
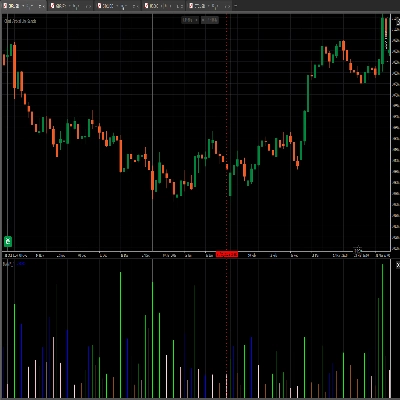
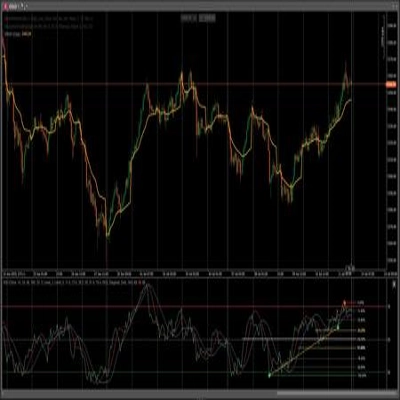
BWMFI_Visual
"BWMFI_Visual" 标识
03/09/2025
35
Desktop
注册日期 10/03/2025
免费安装
72
"BWMFI_Visual" 已上传图片"BWMFI_Visual" 已上传图片

BW_MFI Vizual colors bars

0.0
评价:0
客户评价
该产品尚无评价。已经试过了?抢先告诉其他人!
该作者的其他作品
猜您喜欢
指标
Forex
ms_Candle_ColseTime
⏱ Candle Time Remaining – Real-Time Candle Countdown Indicator
指标
Bollinger
JMA
Jurik Moving Average (Jurik's Moving Average) triple adaptive filter with unique Jurik smoothing and dynamic factor.
指标
NAS100
EURUSD
GBPUSD
Ema
An exponential moving average based on regular trading hours.
指标
Indices
RSI
Signal
[Stellar Strategies] MARSI Signal Plotter
🚀📈 Plot buy/sell signals on Range Bars using Moving Averages and RSI. Clear, actionable trading insights.🚀📈
Scalper Signal MTF
This code is a custom scalping indicator for the cTrader platform.
指标
RSI
Breakout
XAUUSD
+6
Volume POC Heatmap
📊 Shows volume by price levels, highlights POC, and key zones. Identifies dynamic support/resistance and imbalances.
指标
Indices
AI
Machine Learning Momentum Index
The Machine Learning Momentum Index (MLMI) represents the next step in oscillator trading.
指标
Stocks
Forex
Crypto
+1
Market Structure SNR + Auto Bias
Market Structure Indicator – Your Trading Map in a Noisy Market. No more Panicking Which one, Where, Why and How.
CandleColourFlow_MultiFx
CandleColourFlow MultiFx - optimized to work on Fx Majors, Fx MInors, Fx Crosses
指标
NAS100
NZDUSD
XAUUSD
+16
Market Structure Pro
Auto-detect support and resistance & structure, highlight pullbacks/BOS retests, and filter with candle confirmation.
指标
Signal
FAMA-MAMA
The FAMA-MAMA Indicator is a powerful, adaptive trend-following tool designed for professional and algorithmic traders.
指标
NAS100
NZDUSD
Martingale
+26
Daily TPO profile
Daily TPO profile indicator that calculates POC, VAH and VAL for each session. Plots the Point of Control and the 70% Va
Indicatore livelli numeri tondi_fabio23.traders
Indicatore dei livelli numeri tondi sul grafico , regolabile.Indicator of levels round numbers on the graph, adjustable
Head Shoulders Finder
Detects Head & Shoulders patterns, plots signals, and alerts for trading opportunities.
ICT Killzone and Sessions high_low
This indicator is an essential tool for traders seeking to visualize key trading sessions on their charts.
Candelstick xxl
The indicator is designed to detect aggressive movements in the market and without volume for trend changes.
Vishal Volume Profile v2.0
Volume Profile plots traded volume at each price level, highlighting high activity zones of precise support & resistance