说明
介绍
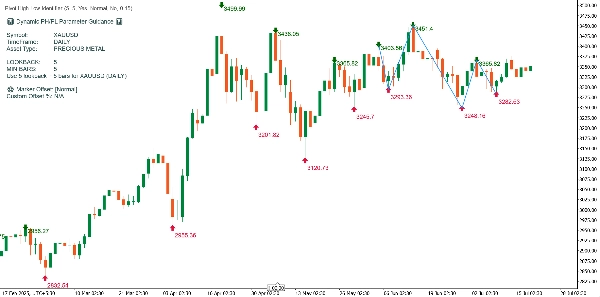
显示的图表使用了自定义的“改进的PH/PL可视化”cTrader指标。该工具动态识别关键的摆动高点和低点(PH/PL),在它们之间绘制锯齿形趋势线,并根据检测到的符号、时间框架和资产类型生成一个信息丰富的指导面板。以下是该指标如何处理和注释示例图表的详细说明。
图表上展示的关键元素
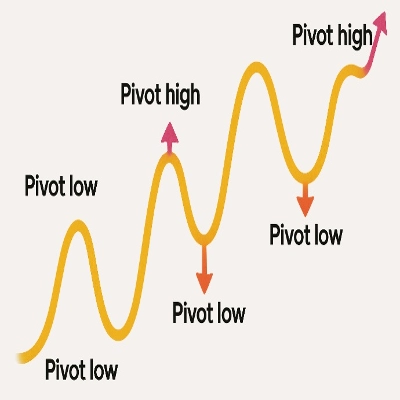
1. 摆动高点(PH)和摆动低点(PL)
- 摆动高点:用绿色向下箭头标记,并在柱状图上方显示相应的高价。
- 摆动低点:用红色向上箭头标记,并在柱状图下方显示相应的低价。
- 使用的逻辑:当某根柱的最高价高于其前后“回溯”柱的最高价时,视为PH;PL则以类似方式定义低点。
- 回溯配置:在您的代码和图表中,使用了回溯值5,产生了适合日线数据的稳健摆动检测。
2. 价格标签
- 可切换显示:每个PH/PL标记附带的价格标签可以通过指标参数显示或隐藏。在此示例中,为了清晰起见显示了价格。
- 偏移自动调整:标签位置通过算法使用最佳间距(预设或自定义)进行偏移,确保文本不会与蜡烛或图表元素重叠。
3. 动态锯齿趋势线
- 可视化:蓝色锯齿线连接最新且重要的PH/PL点,突出显示主要价格摆动的序列。
- 目的:帮助交易者直观跟踪图表期间趋势变化和动量转变。
4. 动态指导面板
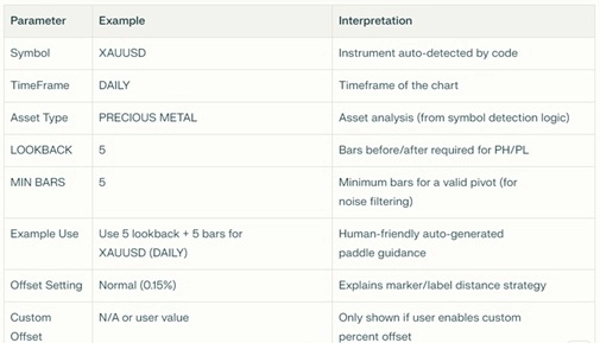
左上角的图表面板总结了关键设置、检测结果和使用建议
指标在此图表上的工作原理
分步说明:
- 摆动识别:
指标在初始化后扫描每根日线柱,比较其两侧五根柱的高低点,以确定PH和PL。 - 标记放置:
使用彩色箭头标记PH和PL;其对应的价格标签以最佳距离定位,确保清晰。 - 趋势可视化:
算法选择最近的10个枢轴点(PH/PL,可配置),并绘制蓝色连线,描绘主要市场摆动,辅助趋势识别。 - 参数面板:
显示面板确认了资产类型的自动检测(此处:XAUUSD,“贵金属”),并为该组合提供了回溯、最小柱数和偏移的最佳推荐值——所有信息均短暂显示。 - 智能资产适应:
如果您将此指标应用于其他符号(如外汇异国货币、加密货币或股票指数),指导面板和检测逻辑会自动调整,为该特定市场行为和时间框架设置推荐的回溯和最小柱数。 - 清爽的图表体验:
所有绘制的图形对象(箭头、趋势线、价格标签、静态文本)在每次计算时都会被清理和重绘,以避免杂乱。指标始终覆盖在价格图表上,绝不在单独面板中显示。
交易实用要点
- 摆动结构识别:您可以快速读取市场摆动的顺序和幅度。
- 进出场规划:PH/PL转折点可用于移动止损逻辑或预测潜在反转点。
- 通用适用:无论资产或时间框架如何,指标都会自我调整并解释其建议。
- 清晰专业的视觉效果:由于智能偏移,价格杂乱和标签重叠被最小化。
总结
此图表展示了改进的PH/PL可视化的强大和清晰。该指标为交易者提供了关于主要枢轴点、摆动方向和幅度以及特定工具和时间框架的上下文指导的即时视觉提示。一切均自动化、实时更新,并可针对任何资产或市场环境进行自定义。
注意:由于cTrader的限制,指标显示了将指标放置在新面板的选项,但由于指标的大小和功能,无法在新面板中查看该指标。此外,如果价格显示距离枢轴箭头过远且用户感到困惑,用户可以手动选择是否显示价格。
如果您需要进一步定制,例如在枢轴点发出声音/警报信号,或对较小摆动进行动态过滤,请随时告知!
摘要
指标配置
客户评价
0.0
评价:0
客户评价
该产品尚无评价。已经试过了?抢先告诉其他人!
讨论
常见问答
cTrader Store 提供的所有产品,包括交易机器人、指标和插件,均由第三方开发者提供,仅供信息参考和技术访问之用。cTrader Store 并非经纪商,不提供投资建议、个人推荐或任何未来业绩保证。
猜您喜欢


价格
注册日期 19/07/2025