
说明
- 它的作用 (它的价值)。
- 它如何帮助交易者。
- 它的独特之处。
- 如何使用它(简要)。
- 付费版本将解锁的内容(预告)。
🔸
交易时段黄金时段指标
(免费版本)
描述
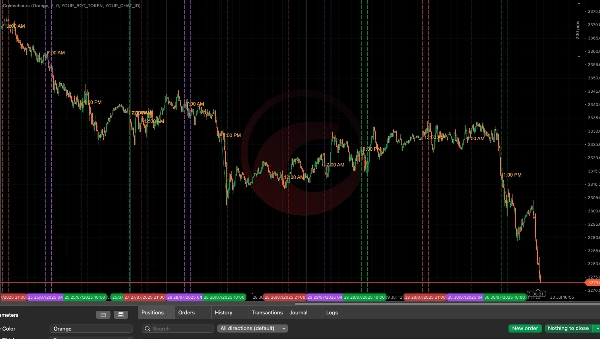
该 交易时段黄金时段 指标专为严肃的交易者设计,旨在根据基于交易时段的流动性模式,直观显示高概率交易窗口。该工具自动突出显示亚洲、伦敦和纽约交易时段的关键时间段——通常被称为市场的“黄金时段”——此时价格最有可能突破区间,揭示机构意图。
它的功能:
- 追踪亚洲交易时段的高点/低点 (00:00–08:00 UTC),以绘制流动性区域。
- 突出显示伦敦和纽约的关键时段 例如:
-
- 伦敦收盘前时段 (06:00–07:00 UTC)
- 伦敦收盘时段 (07:00–08:00 UTC)
- 纽约下午扫盘区 (13:00–14:00 UTC)
- 在图表上绘制视觉引导线 以帮助你关注每日突破时段。
它如何帮助你:
- 轻松识别 流动性扫盘区 在交易时段重叠期间。
- 围绕 聪明资金时间框架 集中你的交易决策——不再在无效时段交易。
- 直观识别假突破和反转常发生的位置。
- 适用于 任何交易品种 和 任何时间框架 只要它们遵循全球交易时段周期。
主要特点:
- 可调节的线条颜色、粗细和时间延伸。
- 自动追踪交易时段,无需手动绘制。
- 内置支持最近15个交易日的数据。
- 简洁、不干扰的图表视觉效果。
适合人群:
- ICT风格交易者(流动性+时间模型)
- 价格行为剥头皮交易者
- 使用基于时间的汇聚点的交易者
🔓 想要更多?
专业版 (即将推出) 增加了:
- 实时突破提醒 直接发送到 Telegram
- 针对 亚洲假突破 → 伦敦反转 和 伦敦高点/低点 → 纽约反转
- 智能冷却计时器,避免过度提醒
- 完整追踪 基于交易时段的高点/低点 并带有信号标注
- 未来路线图:FVG提醒、内部流动性区域和信号过滤
摘要
指标配置
客户评价
4.0
评价:1
5 | 0 % | |
4 | 100 % | |
3 | 0 % | |
2 | 0 % | |
1 | 0 % |
讨论
常见问答
cTrader Store 提供的所有产品,包括交易机器人、指标和插件,均由第三方开发者提供,仅供信息参考和技术访问之用。cTrader Store 并非经纪商,不提供投资建议、个人推荐或任何未来业绩保证。


!["High-Low Divergence [Iridio Capital]" 标识](https://cdn.ctrader.com/image/webp/443c4661-7abb-40f1-842f-4b6ec560649b_40914)


价格
3
免费安装