
说明
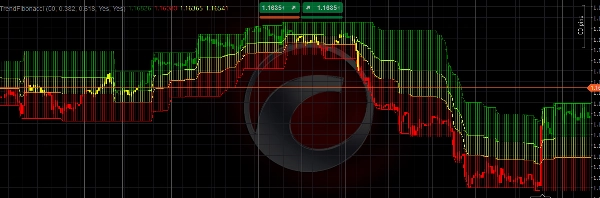
TrendFibonacci 指标旨在帮助交易者精准识别关键价格水平和市场趋势。通过将斐波那契回撤水平与加权移动平均线(WMA)和平均真实波幅(ATR)相结合,该指标提供了支撑、阻力和趋势方向的清晰可视化表现。
主要特点:
- 动态斐波那契水平:根据用户定义的回溯周期,自动计算并绘制斐波那契回撤水平(默认:0.382和0.618),基于最高高点和最低低点。
- 加权移动平均线(WMA):使用6周期WMA来判断趋势方向,蜡烛图颜色编码(绿色表示看涨,红色表示看跌,黄色表示中性)以反映WMA相对于斐波那契水平的位置。
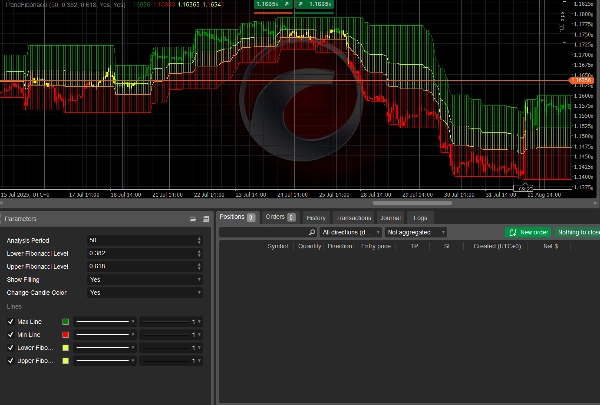
- 可自定义参数:调整分析周期、斐波那契水平,并切换填充区域和蜡烛颜色变化等功能。
- 视觉清晰度:绘制高低线并用半透明颜色填充斐波那契水平之间的区域,便于识别趋势。
- ATR集成:结合200周期ATR进行强有力的市场分析,确保对波动性的适应性。
该指标非常适合希望将斐波那契分析与趋势跟踪策略结合的交易者。无论您交易外汇、股票还是商品,TrendFibonacci 都能增强您识别关键反转区域并做出明智交易决策的能力。
使用方法
- 安装指标:
-
- 通过上传源代码或从市场下载,将TrendFibonacci 指标添加到您的cTrader平台。
- 配置参数:
-
- 分析周期:设置回溯周期(默认:50根K线)以确定计算高低价的范围。
- 较低斐波那契水平:调整较低的斐波那契回撤水平(默认:0.382)。
- 较高斐波那契水平:调整较高的斐波那契回撤水平(默认:0.618)。
- 显示填充:启用/禁用斐波那契水平之间的填充区域(默认:启用)。
- 更改蜡烛颜色:启用/禁用基于WMA位置的颜色编码蜡烛(默认:启用)。
- 解读指标:
-
- 绿色蜡烛:当WMA位于较高斐波那契水平之上时,表示看涨趋势。
- 红色蜡烛:当WMA位于较低斐波那契水平之下时,表示看跌趋势。
- 黄色蜡烛:当WMA位于斐波那契水平之间时,表示中性区域。
- 填充区域:可视化高低线和斐波那契水平之间的关键价格区域,用于支撑/阻力分析。
- 交易应用:
-
- 使用该指标识别斐波那契水平的潜在进出场点。
- 结合其他技术工具(如RSI、MACD)进行确认。
- 监控颜色编码蜡烛以评估趋势强度和方向。
- 最佳实践:
-
- 在模拟账户上测试指标,以熟悉其行为。
- 调整参数以适应您的交易风格和市场状况。
- 在更高时间框架(如H1、H4)上使用,以获得更可靠的信号。
TrendFibonacci 指标是适合各级交易者的多功能工具,提供清晰且可操作的市场趋势和价格水平洞察。
摘要
AI 摘要
TrendFibonacci is a technical indicator designed for traders to identify key price levels and market trends by integrating Fibonacci retracement levels with a 6-period Weighted Moving Average (WMA) and a 200-period Average True Range (ATR). It automatically calculates and plots dynamic Fibonacci levels (default 0.382 and 0.618) based on the highest high and lowest low over a user-defined lookback period. The indicator uses color-coded candles—green for bullish, red for bearish, and yellow for neutral—to reflect the WMA’s position relative to the Fibonacci levels, aiding in trend direction assessment.
Users can customize parameters such as the analysis period, Fibonacci levels, and visual features like filled zones between Fibonacci levels and candle color changes. The indicator visually highlights support and resistance zones by plotting high/low lines and filling areas between Fibonacci levels with semi-transparent colors. It is applicable across various markets including forex, stocks, commodities, and popular symbols like BTCUSD, EURUSD, GBPUSD, and XAUUSD.
TrendFibonacci supports traders in spotting potential entry and exit points at Fibonacci levels and can be combined with other technical tools like RSI and MACD for confirmation. It is recommended for use on higher timeframes (e.g., H1, H4) to enhance signal reliability.
指标配置
客户评价
0.0
评价:0
客户评价
该产品尚无评价。已经试过了?抢先告诉其他人!
讨论
常见问答
BTCUSD
Forex
Signal
EURUSD
Commodities
GBPUSD
NZDUSD
RSI
Fibonacci
Stocks
XAUUSD
NAS100
ATR
MACD
USDJPY
cTrader Store 提供的所有产品,包括交易机器人、指标和插件,均由第三方开发者提供,仅供信息参考和技术访问之用。cTrader Store 并非经纪商,不提供投资建议、个人推荐或任何未来业绩保证。
该作者的其他作品


价格
70.38M
交易量
588.67K
盈利点数
59
销售
4.41K
免费安装