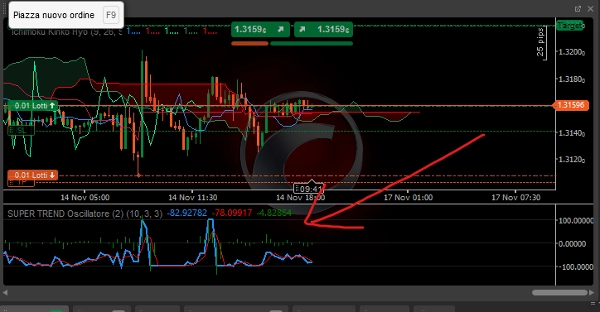
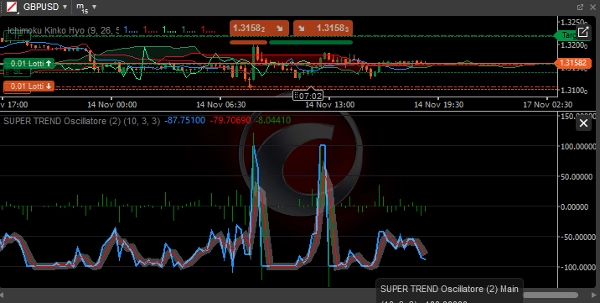
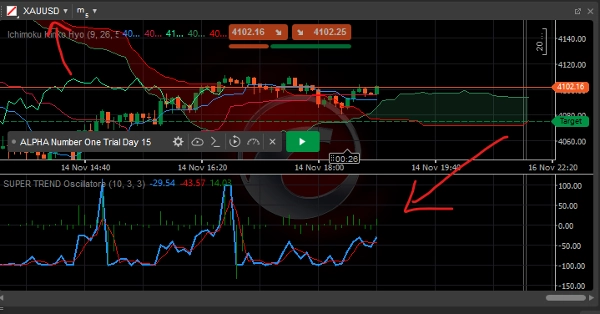
指标
NAS100
Indices
NZDUSD
XAUUSD
Commodities
Forex
Signal
EURUSD
GBPUSD
Crypto
BTCUSD
USDJPY
SUPER TREND Oscillatore
"SUPER TREND Oscillatore" 标识
14/11/2025
Desktop
"SUPER TREND Oscillatore" 已上传图片"SUPER TREND Oscillatore" 已上传图片"SUPER TREND Oscillatore" 已上传图片

SUPER TREND Oscillatore

Simplified SuperTrend Oscillator - Complete Description

Overview

The Simplified SuperTrend Oscillator is an advanced technical indicator for cTrader that transforms the classic SuperTrend into a visual oscillator, making it easy to identify trend direction, strength, and reliability.

Main Components

1. Main Line (Blue)

  • Function: Shows the normalized distance between price and SuperTrend line
  • Calculation((Price - SuperTrend) / (ATR × Multiplier)) × 100
  • Interpretation:
    • > 0: Bullish trend (price above SuperTrend)
    • < 0: Bearish trend (price below SuperTrend)
    • Range: From -100 to +100

2. Signal Line (Red)

  • Function: Simple moving average of the main line
  • Period: Customizable (default 3 periods)
  • Usage: Filters market noise and confirms signals

3. Histogram (Gray)

  • Function: Difference between main line and signal line
  • Interpretation:
    • Positive: Bullish momentum accelerating
    • Negative: Bearish momentum accelerating
    • Zero crossover: Potential momentum reversals

Configurable Parameters

SuperTrend Parameters:

  • ATR Period: Period for Average True Range calculation (default: 10)
  • Multiplier: Multiplier for SuperTrend bands (default: 3.0)

Oscillator Parameters:

  • Signal Period: Period for signal line (default: 3)

Signal Interpretation

Trend Conditions:

  • Strong Bullish Trend:
    • Main > +50
    • Main > Signal
    • Positive histogram
  • Strong Bearish Trend:
    • Main < -50
    • Main < Signal
    • Negative histogram
  • Ranging Market:
    • Main between -30 and +30
    • Frequent line crossovers

Trading Signals:

Long Entry:

  1. Main crosses above 0
  2. Histogram turns positive
  3. Signal line confirms bullish
  4. Main above +20 for momentum

Short Entry:

  1. Main crosses below 0
  2. Histogram turns negative
  3. Signal line confirms bearish
  4. Main below -20 for momentum

Exit/Take Profit:

  • Long: Main > +80 (overbought) or cross below Signal
  • Short: Main < -80 (oversold) or cross above Signal

Advantages of Simplified Version

1. Optimized Performance

  • More efficient calculations
  • Lower resource consumption
  • Faster response to price changes

2. Ease of Use

  • Reduced essential parameters
  • Immediate visual signals
  • Easy interpretation even for beginner traders

3. Reliability

  • Less susceptible to noise
  • Cleaner and more defined signals
  • Reduced false signals compared to classic SuperTrend

Usage Strategies

Trend-Following Strategy:

  • Entry: Main > 0 for long, Main < 0 for short
  • Filter: Histogram same sign as Main
  • Exit: Sign reversal or extreme levels reached

Momentum Strategy:

  • Entry: Main > +30 (long) or Main < -30 (short)
  • Confirmation: Histogram accelerating
  • Exit: Momentum deceleration (histogram decreasing)

Mean Reversion Strategy:

  • Entry: Main > +80 (short) or Main < -80 (long)
  • Confirmation: Histogram reversal
  • Exit: Return toward neutral zone

Optimal Market Conditions

Trending Markets:

  • High efficiency
  • Prolonged signals
  • Fewer whipsaws

Ranging Markets:

  • Reduce lot size
  • Extend timeframe
  • Use as momentum filter

Best Practices

Recommended Timeframes:

  • Intraday: M15 - H1
  • Swing Trading: H4 - D1
  • Position Trading: W1 - MN

Risk Management:

  • Stop Loss: 1.5-2 × ATR
  • Take Profit: 2-3 × Risk
  • Position Size: 1-2% per trade

Additional Confirmations:

  • Multiple timeframe alignment
  • Volume confirmation
  • Key support/resistance levels

Limitations

Considerations:

  • Inherent lag (trend-following indicator)
  • Reduced performance in ranging markets
  • Need for confirmations in low volatility

Recommendations:

  • Combine with price action analysis
  • Use as filter, not standalone system
  • Demo test before live use

This oscillator represents a powerful tool for identifying strong trends and filtering false signals while maintaining operational simplicity suitable for both beginner and experienced traders.

0.0
评价:0
客户评价
该产品尚无评价。已经试过了?抢先告诉其他人!
该作者的其他作品
cBot
XAUUSD
Forex
GALAXY XAUUSD SCALPER Trial DAY 15
cBot
XAUUSD
Forex
ALPHA Number One LIVe
ALPHA Number One Live
cBot
XAUUSD
Forex
ALPHA Number One Trial Day 15
cBot
XAUUSD
Commodities
Forex
CrudeOilRobot
Crude Oil Robot LIVE
cBot
XAUUSD
Forex
LowRiskJesko Trial DAY 15
Low Risk Jesko Trial DAY 15
cBot
XAUUSD
Forex
GALAXY XAUUSD Scalper LIVE
cBot
Commodities
Forex
EURUSD
+1
BANK Trader VIP Trial DAY 15
cBot
XAUUSD
Forex
LOW Risk Jesko LIVE
LOW Risk Jesko LIVE
cBot
XAUUSD
Commodities
Forex
+1
Crude Oil TRIAL DAY 15
cBot
Commodities
Forex
EURUSD
+1
BANK Trader VIP Live
cBot
NAS100
NZDUSD
XAUUSD
+7
Evolving financial strategy Trial Day 15
cBot
NAS100
NZDUSD
XAUUSD
+5
Evolving financial strategy LIVe
Evolving financial strategy LIVE
指标
XAUUSD
Commodities
Forex
+4
SUPER TREND OSCILLATOR TRIAL DAY15
猜您喜欢
指标
Breakout
Signal
Bollinger
[Hamster-Coder] Bollinger Bands
Bolliger Bands + Hamster-Coder™ Timeframe Decoupling
指标
Forex
MM-Symbol Info (free)
Enhance the trading experience with real-time Spread, Time To Close, rPNL, uPNL, PNL and minimalistic Bid / Ask lines
指标
Breakout
ATR
Signal
[Stellar Strategies] Market Structure Breakout
Flags breakouts of recent highs/lows on cTrader charts. Shows arrows/lines. Optional trend filter & sound alerts 📉📈
指标
EURUSD
Compare Symbol
Plots chosen symbol's close price, candlestick (wick, body) on cTrader chart, supports multiple timeframes.
指标
Breakout
ORB v1
Opening Range Breakout (ORB) - Visual Edition
指标
Indices
RSI
Signal
[Stellar Strategies] MARSI Signal Plotter
🚀📈 Plot buy/sell signals on Range Bars using Moving Averages and RSI. Clear, actionable trading insights.🚀📈
Candlestick Patterns - Special Candles
Boost your trading with Candlestick Patterns for cTrader – auto-detect key signals for smarter, faster decisions!
指标
RSI
Indices
StochasticRSI
Stochastic RSI (StochRSI) is a technical indicator used to measure the strength and weakness of the RSI.
指标
Breakout
Scalping
SSL Channel
SSL Channel — Trusted by price action traders to stay on the right side of the trend.
指标
NAS100
Prop
XAUUSD
+5
Support and Resistance MTF Pro
🟢 Strength-ranked S/R zones with MTF levels and Pro labels. Nearest-zone band and HUD for faster, cleaner entries. 🔴
指标
Grid
Indices
Prop
+4
Round Numbers
Automatically draws major, minor, and trace support/resistance levels at round numbers
CandleColourFlow_Limited_EURUSD
CandleColourFlow – smart color-coded trend indicator.
指标
Indices
Forex
Signal
+2
US Dollar Index
US Dollar Index
指标
NAS100
RSI
NZDUSD
+18
HAIQuantum-V10
The HAI Quantum V10 is an advanced indicator designed for technical analysis
IR Moving MTF
multi time frame moving averge. you could choose different type of price like median ,high and ... and differnt type of
指标
Indices
Prop
Stocks
+5
New Way Sar - Free
The Parabolic SAR, or "Stop and Reverse," is a dynamic technical analysis tool
Parabolic RSI Alert  V1
Master RSI reversals with Parabolic SAR precision! Get real-time alerts for high-probability trend changes.
指标
NAS100
EURUSD
GBPUSD
Ema
An exponential moving average based on regular trading hours.