
说明
MarketSessions – 您的交易优势,可视化呈现
将市场时间转化为交易力量
MarketSessions 是一款专业级的 cTrader 指标,生动展示全球市场时段——让您能够在动能真实且时机成为您优势的地方进行交易。
🚀 为什么交易者信赖 MarketSessions
洞察市场节奏
即时可视化伦敦、纽约、东京、悉尼——以及您想要的任何其他时段——通过简洁优雅的叠加层,适应您的图表。
更聪明地交易,而非更晚
当时段开启、关闭或达到关键水平时,实时接收通知——通过 Telegram 或 Discord 发送(由您选择)。
锁定高概率区域
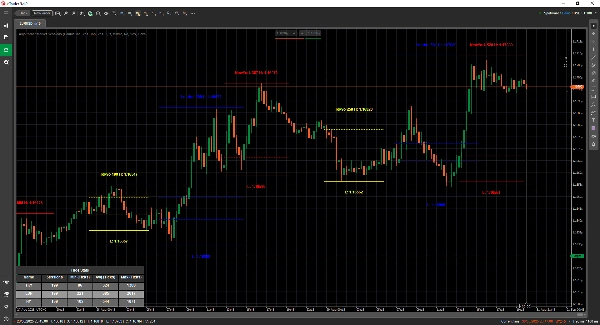
利用内置工具,如开盘区间突破、控制点 (POC)和精准时段线,确保您不错过任何突破或反转。
🎯 主要功能
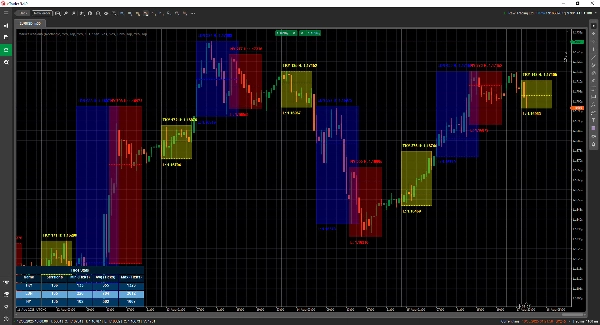
- 时段可视化与管理 – 完全可定制的时间、颜色和标签,甚至支持重叠市场
- 高级绘图工具 – 包含双线 ❘❘ 和中线绘制器、突破矩形、文本标记及双线模式,适合极简交易者
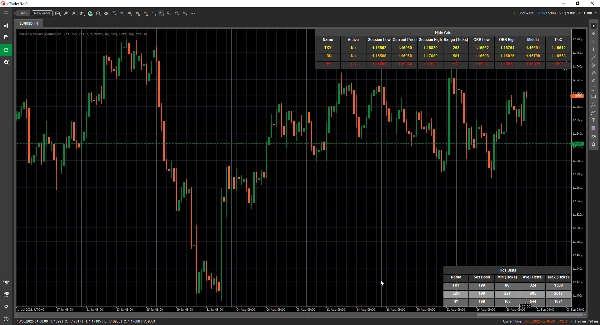
- 统计面板 – 查看每个时段的总时段数、最小、平均和最大区间(以点数、点差或百分比计)
- 网格模式 - 允许您在表格中查看当前活跃时段,以便在更高时间框架中观察时段。
- 灵活配置 – 自定义文本位置、区间模式、绘图偏好和主题
- 提醒与集成 – Telegram/Discord 集成,带声音和视觉提醒
📦 您将获得
- MarketSessions.algo(即用型)
- 终身更新(无持续费用)
- 友好支持(需要帮助时可直接联系)
💻 需求
- cTrader 平台
- .NET 6.0 运行时
✅ 几分钟内安装完成
✅ 绝对自信地交易
📘 参数参考(友好版)
可用时段列表
- 纽约
- 伦敦
- 法兰克福
- 东京
- 香港
- 上海
- 新加坡
- 惠灵顿
- 悉尼
- 多伦多
通用设置
- 绘图模式 – 选择时段线在图表上的绘制方式(矩形 / 双线 / 中线)
- 显示时段名称 – 直接在图表上显示每个时段的名称
- 时段名称位置 – 决定时段名称文本出现的位置(顶部、中间、底部)
- 文本加粗 – 使时段名称加粗,便于阅读
- 顶部文本偏移 – 从顶部增加额外间距(避免文本与蜡烛重叠)
- 底部文本偏移 – 从时段区域底部增加额外间距
- 文本时间位置 – 显示时段时间及名称
- 使用短时段名称 – 切换为短名称(如 NY 代替纽约)
- 显示时段区间 – 突出显示时段覆盖的完整价格区间
- 时段区间模式 – 选择价格区间的计算方式(高/低或开/收)
- 时段区间位置 – 将区间标记放置在区间的顶部或底部
- 显示最高价 – 显示时段的最高价格
- 最高价位置 – 选择最高价标签出现的位置
- 显示最低价 – 显示时段的最低价格
- 最低价位置 – 选择最低价标签出现的位置
- 延长最高/最低线(分钟) - 允许将这些线向前延长 x 分钟
- 显示开盘区间突破 – 在时段开盘处绘制突破框
- 延长 ORB 线(分钟) - 允许将这些线向前延长 x 分钟
- 显示中线 – 添加中线以帮助识别公允价值
- 延长中线(分钟) - 允许将此线向前延长 x 分钟
- 显示控制点 – 显示控制点(时段内交易量最大的价格)
- 延长中线(分钟) - 允许将此线向前延长 x 分钟
- 填充透明度 – 控制时段背景填充的透明度
统计
- 绘制统计 – 在图表上显示/隐藏统计面板
- 统计水平对齐 – 对齐面板(左 / 中 / 右)
- 统计垂直对齐 – 选择面板显示在顶部还是底部
- 标题颜色 – “统计”标题的文本颜色
- 偶数行颜色 – 面板中偶数行的背景颜色
- 奇数行颜色 – 面板中奇数行的背景颜色
- 前景色 – 面板内使用的文本颜色
Telegram
- 启用 – 启用或禁用 Telegram 提醒
- 令牌 – 您的 Telegram 机器人令牌
- 聊天 ID – 发送提醒的聊天 ID
Discord
- 启用 – 启用或禁用 Discord 提醒
- WebhookUrl – 用于发送时段提醒的 Discord webhook URL
声音提醒
- 新时段声音提醒 – 新时段开始时播放声音
- 时段完成声音提醒 – 时段结束时播放声音
网格
- 强制网格 - 强制渲染网格,无论使用何种时间框架
- 网格在以上时间框架可见 - 允许您选择从哪个时间框架及以上显示此网格
- 消息框通知 - 通知为何无法使用正常渲染模式并切换到网格模式
- 网格水平对齐
- 网格垂直对齐
时段示例(纽约)
⚠️ 相同参数适用于每个时段(伦敦、东京、悉尼等)
- 启用 – 启用或禁用此特定时段
- 颜色 – 图表上使用的时段颜色
- 填充区域 – 填充时段区域的背景
- 线条样式 – 选择线条样式(实线、虚线等)
- 线条粗细 – 控制时段边界的粗细
让市场的时钟成为您的盟友
立即获取 MarketSessions,再也不错过任何盈利时段。
摘要
AI 摘要
Market Sessions With Stats is a professional-grade indicator designed for the cTrader platform that visualizes global market sessions such as New York, London, Tokyo, Sydney, and others. It provides detailed overlays on charts, including customizable session times, colors, and labels, with support for overlapping markets. The indicator features advanced drawing tools like double and middle line modes, breakout rectangles, and text markers to highlight key session levels.
Users can view comprehensive session statistics, including total sessions, minimum, average, and maximum ranges measured in ticks, pips, or percentages. A grid mode enables viewing active sessions in a table format suitable for higher timeframes. The indicator supports real-time alerts via Telegram or Discord for session openings, closings, and key levels, complemented by sound and visual notifications.
Additional configurable options include display preferences for session names, price ranges, high/low prices, opening range breakouts, middle lines, and the Point of Control (most traded price). The indicator requires the .NET 6.0 runtime and offers lifetime updates and support. It is applicable to major forex symbols such as EURUSD, GBPUSD, NZDUSD, and USDJPY.
指标配置
客户评价
5.0
评价:1
5 | 100 % | |
4 | 0 % | |
3 | 0 % | |
2 | 0 % | |
1 | 0 % |
客户评价
January 4, 2026
The review feels more structured, but the market context still matters.
讨论
常见问答
Forex
EURUSD
GBPUSD
NZDUSD
USDJPY
cTrader Store 提供的所有产品,包括交易机器人、指标和插件,均由第三方开发者提供,仅供信息参考和技术访问之用。cTrader Store 并非经纪商,不提供投资建议、个人推荐或任何未来业绩保证。
该作者的其他作品


价格
11
销售
353
免费安装