
説明
McGinley Dynamic は、実際には非常に 実用的な 移動平均に関する観察から生まれた過小評価されがちな技術ツールの一つです。
これは John R. McGinley, CMT によって作られ、その主な目的は 従来の移動平均の一般的な問題を解決すること — すなわち、遅延 と 騙し(ホイップソー) を市場の速度変動によって引き起こされるものです。
具体的に 対処しようとしている ことは次の通りです:
🧩 1. 移動平均の遅延
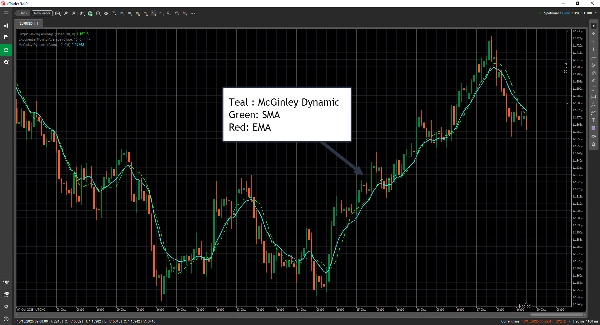
- 通常の移動平均(SMA、EMA)は固定された遡及期間に基づいているため、価格に遅れが生じます。
- McGinley Dynamicは自動的に 市場の速度に基づいて平滑化を調整します。
市場が速く動くときは調整を速め、市場が遅くなるとより穏やかに平滑化します。
👉 結果:それは 価格をより正確に追跡し 過剰反応しません。
🌪️ 2. 変動の激しい期間の騙し(ホイップソー)
- 従来の移動平均は荒れた市場で誤ったシグナルを出すことがあります。
- McGinleyは 市場の動きの速さに比例して調整される動的分母 を導入しました。
これによりノイズが減り、不要なクロスオーバーシグナルを回避 できます。
⚙️ 3. より滑らかで自己修正的な動作
- それはほぼ 自動調整移動平均 のように機能し、期間を細かく調整する必要があまりありません。
- これによりユーザー入力や市場の変動に対して敏感さが減り、いわば「スマートな」移動平均となっています。
概要
AIによる概要
AlgoCorner McGinley Dynamic is a technical indicator designed to improve upon traditional moving averages by reducing lag and false signals. Created by John R. McGinley, CMT, it automatically adjusts its smoothing based on market speed, allowing it to track price movements more closely without overreacting. The indicator employs a dynamic denominator that changes in proportion to market velocity, helping to minimize whipsaws and avoid unnecessary crossover signals during volatile or choppy market conditions. Acting as a self-correcting, auto-adjusting moving average, it requires less fine-tuning of parameters and is less sensitive to market volatility and user input. This makes it a practical tool for traders seeking a smoother, more responsive moving average that adapts naturally to changing market dynamics. It is applicable to Forex markets, including currency pairs such as EURUSD and GBPUSD.
インジケーターのプロフィール
カスタマーレビュー
0.0
レビュー: 0
カスタマーレビュー
この商品にはまだレビューがありません。お使いになったことがある方は、ぜひレビューをお願いします。
ディスカッション
よくあるご質問
Forex
EURUSD
GBPUSD
cTrader Storeで入手可能な取引ボット、インジケーター、プラグインなどの商品は、第三者の開発者が提供するものであり、情報と技術の取得のみを目的としてご利用いただけます。cTrader Storeはブローカーではなく、投資助言や個人的な推奨を行うことも、将来のパフォーマンスを保証することもありません。
この作成者の他の商品


価格
10
販売
351
無料インストール