
说明
Crosshair Edge:最佳的cTrader数据可视化工具
借助Crosshair Edge,这是一款增强cTrader平台内市场数据可视化的强大工具,您可以将图表分析提升到新的高度。
增强的图表交互
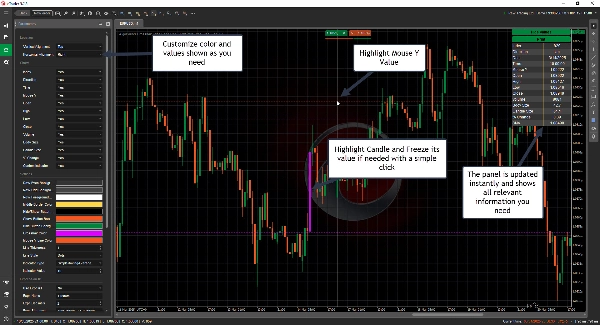
- 突出显示当前柱及其范围
- 点击即可冻结十字线在特定蜡烛上,必要时再次点击解锁
- 将数值发送到日志,方便复制
- 根据需要显示或隐藏布局
完全自定义
- 个性化颜色以符合您的风格
- 将十字线调整到图表内任意位置
- 选择显示哪些数值,省略哪些数值
即时蜡烛数据展示
只需将鼠标悬停在任意蜡烛上,即可查看所有详情及更多信息
- 索引
- 方向
- 日期
- 时间
- 鼠标Y轴价格
- 开盘价
- 最高价
- 最低价
- 收盘价
- 成交量
- 实体大小
- 蜡烛大小
- 百分比变化
- 多个指标数值
-
- ADX
- ATR
- Chaikin资金流量
- EMA, HMA, SMA, TSMA, TMA, WMA
- 平衡成交量
- RSI
- 标准差
- 加权收盘价
- Welles Wilder平滑
- Williams %R
- 使用便捷快捷键绘制水平/垂直线
-
- 绘制水平线:Ctrl + 1
- 绘制垂直线:Ctrl + 2
- 快捷键完全可自定义
- 可自定义公式
-
- 使用开盘价、最高价、最低价、收盘价和索引计算符合您需求的公式
- 例如,典型价格:(High[index] + Low[index] + Close[index])/3.0
无缝集成
- 许可证绑定您的cTrader ID,使用更便捷
- 包含未来更新
今天就用Crosshair Edge升级您的交易体验! 🚀
摘要
指标配置
客户评价
5.0
评价:1
5 | 100 % | |
4 | 0 % | |
3 | 0 % | |
2 | 0 % | |
1 | 0 % |
讨论
常见问答
Indices
RSI
ATR
cTrader Store 提供的所有产品,包括交易机器人、指标和插件,均由第三方开发者提供,仅供信息参考和技术访问之用。cTrader Store 并非经纪商,不提供投资建议、个人推荐或任何未来业绩保证。
该作者的其他作品


价格
11
销售
353
免费安装