
说明
SmartTrendScanner
概述
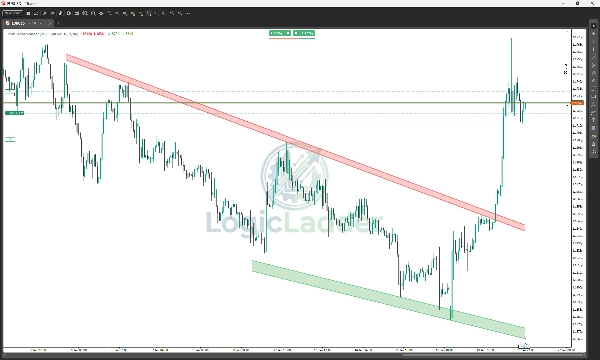
SmartTrendScanner 是一款专业级的cTrader指标,旨在自动化趋势分析这一主观艺术。与传统的绘制细线单价趋势线的指标不同,SmartTrendScanner识别并可视化动态的 供需云区。
该指标由“最佳拟合”算法驱动,扫描历史价格行为以寻找最具数学意义的连接点,绘制代表真实支撑和阻力区域的填充通道。
主要特点
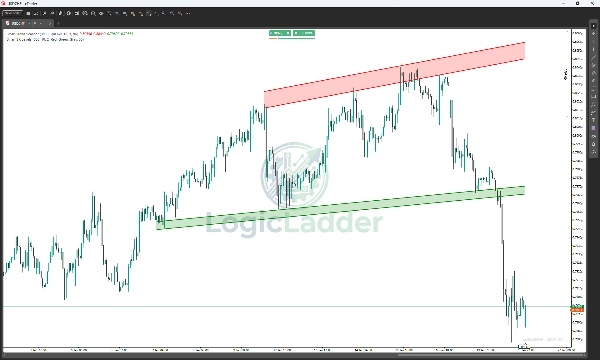
- 动态云区: 用填充的“云”通道替代细线,直观覆盖价格触及的整个范围(影线和实体),防止假突破。
- 智能枢轴检测: 根据您的自定义灵敏度设置自动识别关键的摆动高点和摆动低点。
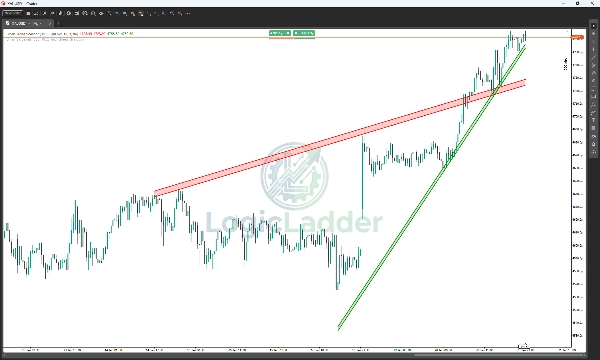
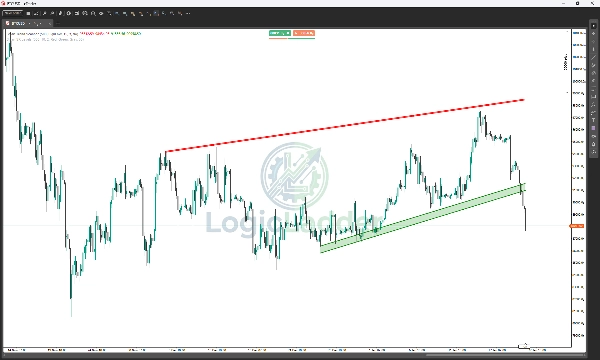
- 最佳拟合算法: 指标在后台创建数千条潜在趋势线,并筛选出最强、最受尊重且最接近当前价格的区域进行显示。
- 稳定性过滤器: 内置逻辑检查结构破坏,确保您不会基于无效或过时的水平进行交易。
- 实时提醒: 不错过任何行情。当价格突破区域或回测水平时,立即弹出通知和声音提醒。
- 完全可定制: 调整云的透明度、颜色、枢轴强度和回溯历史,以适应您的交易风格(剥头皮、日内交易或波段交易)。
工作原理
- 扫描历史: 指标回溯用户定义的柱数(例如300根柱)以寻找分形枢轴点。
- 连接点: 测试枢轴之间的连接以寻找有效的趋势斜率。
- 验证区域: 检查价格是否在近期足够多次“触及”预测线(最小触及次数),且未显著突破。
- 绘制云区: 一旦找到有效趋势,绘制最高影线触点和最低实体触点之间的透明云,形成“行动区域”。
设置指南
- 应用柱数: 扫描器回溯历史的深度(默认:300)。增加此值适合长期波段交易。
- 枢轴强度: 分形检测的灵敏度。较高数值(如15以上)找到主要结构点;较低数值(如5)找到次级内部结构。
- 最小枢轴确认: 价格必须触及区域的最少次数,才能被视为有效。
- 区域透明度: 控制填充颜色的不透明度(0 = 不可见,255 = 实心)。
为什么选择LogicLadder?
交易讲究概率,而非确定性。通过将支撑和阻力可视化为区域而非细线,SmartTrendScanner帮助您看到真实的流动性藏匿之处,让您领先于大众一步。
摘要
AI 摘要
Smart Trend Scanner is a professional-grade indicator for the cTrader platform that automates trend analysis by identifying and visualizing dynamic supply and demand zones as filled cloud channels rather than traditional thin trendlines. Using a "Best-Fit" algorithm, it scans historical price data to detect key swing highs and lows, connecting these pivot points to form mathematically significant support and resistance zones. The indicator validates zones by confirming multiple price touches without significant recent breaks, then draws transparent clouds between the highest wick and lowest body touches to represent true areas of market interest.
Key features include dynamic cloud zones that cover the full price range to reduce false signals, intelligent pivot detection adjustable by sensitivity, stability filters to avoid outdated levels, and real-time alerts for breakouts or retests. Users can customize settings such as lookback period, pivot strength, minimum touches for zone validation, and cloud transparency to suit various trading styles including scalping, day trading, and swing trading.
Smart Trend Scanner supports multiple markets including Forex, commodities, stocks, and cryptocurrencies, with symbol tags like BTCUSD, EURUSD, GBPUSD, XAUUSD, and NAS100. It aims to provide clearer visualization of liquidity zones to assist traders in making informed decisions based on probabilistic support and resistance areas.
指标配置
客户评价
0.0
评价:0
客户评价
该产品尚无评价。已经试过了?抢先告诉其他人!
讨论
常见问答
BTCUSD
Forex
EURUSD
Commodities
GBPUSD
NZDUSD
Prop
Scalping
Crypto
Stocks
XAUUSD
NAS100
USDJPY
cTrader Store 提供的所有产品,包括交易机器人、指标和插件,均由第三方开发者提供,仅供信息参考和技术访问之用。cTrader Store 并非经纪商,不提供投资建议、个人推荐或任何未来业绩保证。
该作者的其他作品


猜您喜欢


价格
注册日期 09/01/2026
704
免费安装