说明
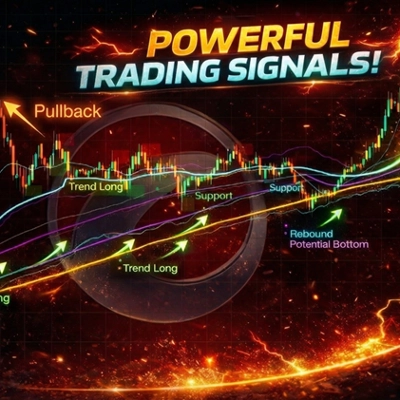
Trend SR 系统是一种趋势导向的图表指标,旨在帮助交易者更清晰地识别市场环境、关键 EMA 结构、动态支撑/阻力位以及潜在的延续或短期均值回归区域。
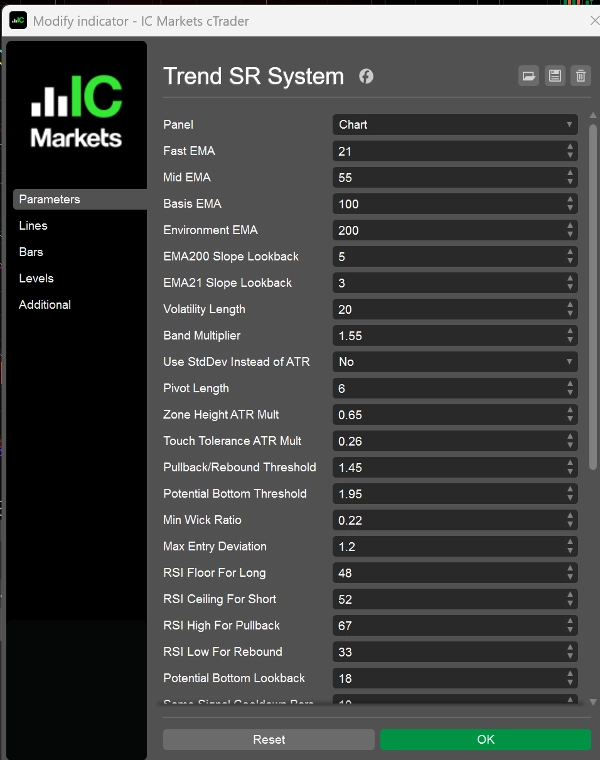
该指标基于 EMA21、EMA55、EMA100 和 EMA200 构建:
- EMA200 用作更高层次的市场环境过滤器
- EMA100 作为价格中心轴和带状基线
- EMA55 帮助识别中期支撑和阻力压力
- EMA21 用于跟踪短期节奏、回调和回撤
此外,该指标结合了波动率带、基于枢轴的结构区和阶梯式动态支撑/阻力逻辑,以提供更结构化的市场视图。
主要特征
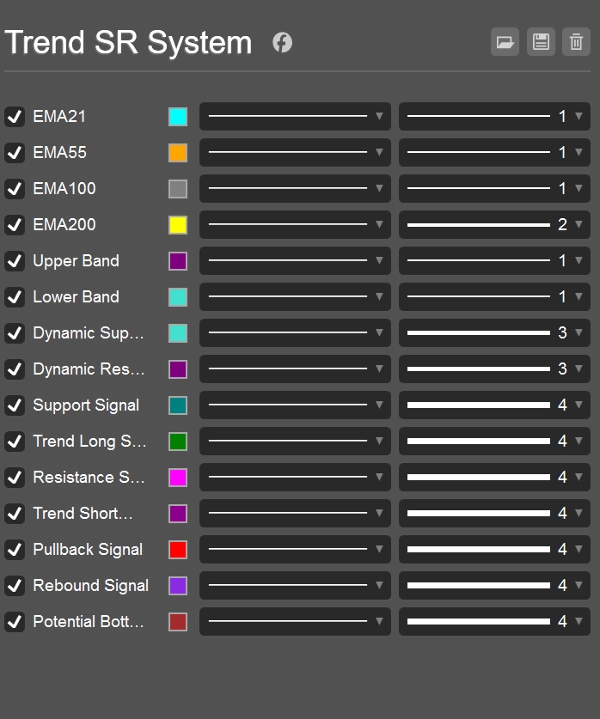
- 显示4条关键的EMA结构线
- 显示基于ATR或标准差的上下轨带
- 生成动态支撑和动态阻力水平
- 使用枢轴逻辑检测结构性支撑/阻力区域
- 提供延续型和短期修正型信号
- 允许单独开启或关闭信号类型
信号类型
- 支撑
牛市环境中的关键支撑区域,表明价格在回调后受到支撑。 - 趋势多头
牛市中的趋势跟随多头信号,通常出现在回调后恢复上行动能时。 - 阻力
熊市环境中的关键阻力区域,表明价格在回撤后受到压制。 - 趋势空头
熊市中的趋势跟随空头信号,通常出现在反弹失去动力后下跌趋势恢复时。 - 回调
牛市环境中的短期超买警告,提示可能的回调或盘整风险。 - 反弹
熊市环境中的短期超卖警告,提示可能的技术性反弹风险。 - 潜在底部
较强的超卖恢复型信号,强调可能尝试形成临时底部。
典型使用场景
该指标适用于:
- 趋势跟踪分析
- 回调和回撤的入场时机
- EMA结构及支撑/阻力观察
- 监测超买或超卖的牛市或熊市状况
- 基于图表的交易过滤和自由裁量决策支持
可用于外汇、指数、金属、加密货币及其他趋势市场。
最佳适用对象
该指标适合以下交易者:
- 希望获得更清晰、更结构化的图表视图
- 关注趋势延续和关键反应区域
- 结合EMA结构与价格行为及支撑/阻力使用
- 偏好短中期布局的视觉交易辅助
使用说明
- 最好结合市场环境和良好的风险管理一起使用
- 信号不应被视为独立的交易建议
- 在震荡或低波动市场条件下信号质量可能下降
- 此工具旨在作为图表分析和交易支持工具,而非保证性能的系统
摘要
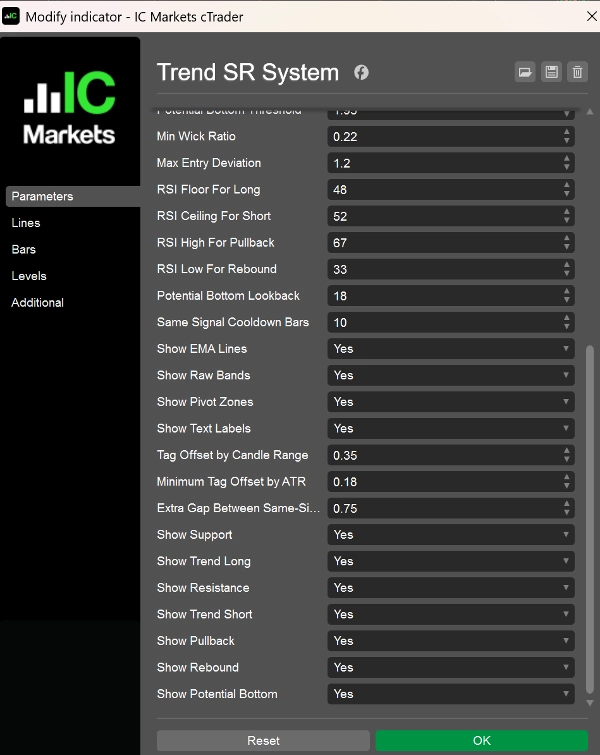
指标配置
指标分类
趋势
输出类型
信号
数据要求
仅 K 线
支持的信号
反转
突破
趋势强度
客户评价
4.0
评价:1
5 | 0 % | |
4 | 100 % | |
3 | 0 % | |
2 | 0 % | |
1 | 0 % |
讨论
常见问答
Prop
Forex
Signal
Indices
Supertrend
Commodities
RSI
Crypto
Stocks
ATR
cTrader Store 提供的所有产品,包括交易机器人、指标和插件,均由第三方开发者提供,仅供信息参考和技术访问之用。cTrader Store 并非经纪商,不提供投资建议、个人推荐或任何未来业绩保证。
该作者的其他作品


价格
注册日期 25/03/2026