说明
PROPFOLIO MASTER SUITE:使用说明书
平台: cTrader 版本: 1.0(符合商店规范版) 由以下提供支持: Propfolio Solutions
欢迎使用 PropFolio Peak Formation SMC 仪表盘。这是一套完整的机构图表套件,旨在将智能资金概念(SMC)、击败市场制造者(BTMM)追踪和成交量剖面分析整合到一个轻量、高度优化的 cTrader 指标中。
📥 1. 安装指南
- 下载
PropFolioPeakFormationSMCDashbaord.algo文件。 - 双击
.algo文件。cTrader 会自动打开并安装它。 - 打开 cTrader 中的任意图表。
- 右键点击图表 -> 指标 -> 自定义 -> 选择 PropFolioPeakFormationSMCDashbaord。
- 点击 确定 应用。
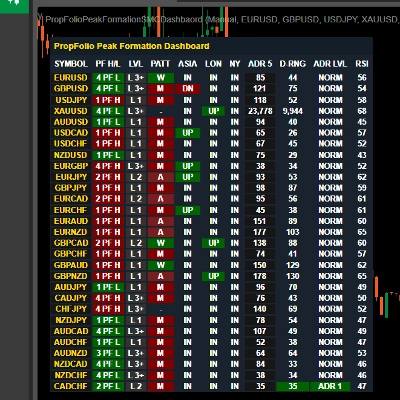
📊 2. 仪表盘说明
该套件具有多符号仪表盘,实时跟踪11列中的机构市场状态。
- 符号: 被跟踪的货币对。您可以在指标设置中定义自定义列表。
- PF H/L(峰值形成): 显示当前5天周期是处于峰值形成高点(PFH)还是峰值形成低点(PFL),以及形成了多少天。
- LVL(级别): 当前BTMM周期级别(级别1、级别2或级别3及以上)。
- PATT(模式): 识别日内机构模式。
-
- M / W: 标准的M和W形态。
- A / V: A顶和V底。
- 亚洲 / 伦敦 / 纽约: 显示当前价格相对于该特定交易时段区间的状态。
-
- 上涨(绿色): 价格已突破该时段高点。
- 下跌(红色): 价格已跌破该时段低点。
- 区间(灰色): 价格在该时段区间内波动。
- ADR 5: 最近5天的平均日波幅(以点计)。
- 日波幅: 当前日波幅(以点计)。
- ADR 级别: 显示当前日是否已耗尽其ADR。
-
- 正常: 正常区间。
- ADR 1 / 2 / 3: 价格已突破正常日成交量的1倍、2倍或3倍(预期疲软/反转)。
- RSI: 15分钟RSI,用于快速识别超买(红色)或超卖(绿色)状态。
👁️ 3. 图表视觉效果及SMC工具
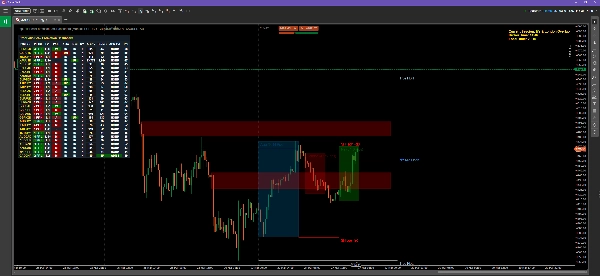
1. 杀区(流动性盒子) 指标自动绘制透明盒子,分别对应 亚洲、伦敦 和 纽约 交易时段。每个盒子的点数大小标注在底部。
2. 诱多线(BTMM) 线条绘制在亚洲时段盒子上下方25和50点处。这些是机构目标,市场制造者在反转趋势前会猎杀散户止损。
3. 真实前日高点与低点 银色线条标记 真实前日高点 和 前日低点,严格根据真实亚洲开盘至真实纽约收盘计算(忽略无效的滚存成交量)。
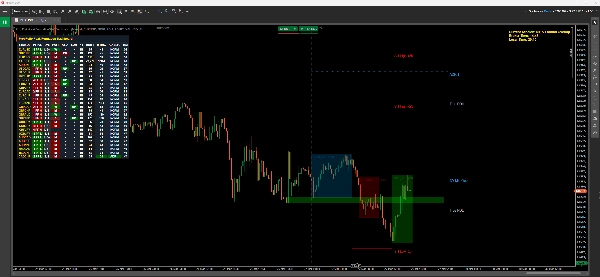
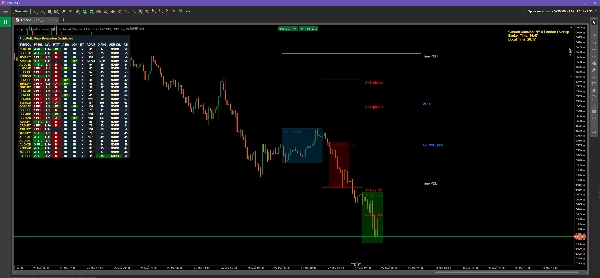
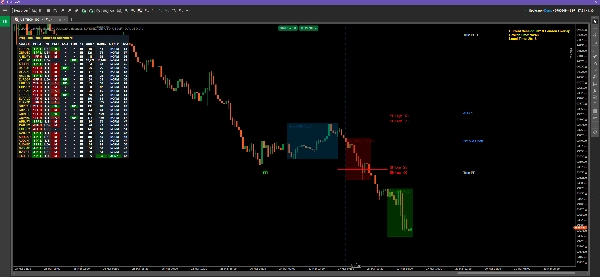
4. 供需(S&D) 引擎扫描最近150根蜡烛图,寻找机构失衡。
- 红色盒子: 未被消化的供应区(卖出区)。
- 绿色盒子: 未被消化的需求区(买入区)。
- 注意:价格完全消化(测试)后,区域会消失。
5. ADR目标线 基于峰值形成,指标投射橙色或蓝色虚线,标记当天1倍、2倍和3倍平均日波幅的耗尽目标。
📈 4. 成交量剖面(灵活与固定)
指标内置完整的成交量剖面引擎,用于寻找控制点(POC)和价值区高/低(VAH/VAL)。
如何使用灵活模式:
- 在指标设置中,确保 VP 模式 设置为
Flexible。 - 图表上将出现两条垂直的 水绿色虚线。
- 只需点击并拖动这些线条,即可勾勒图表上的任意价格区间。
- 成交量剖面直方图、POC和价值区将即时计算并自动对齐到两条线之间的精确区域!
如何使用固定模式: 将模式设置为 FixedDaily。剖面将自动计算当前交易日的成交量,无需可拖动线条。
⚙️ 5. 时间HUD与提醒
高级时间HUD 在右上角,您将看到一个金色文本显示。它自动计算您的经纪商时间、本地计算机时间,并准确告诉您当前激活的是哪个交易时段(例如,“纽约与伦敦重叠”)。
终端提醒 当出现新的峰值形成时,通知将直接打印在您的 cTrader Automate -> 日志 标签中,确保您不会错过任何设置。 注意:有关高级外部推送通知,请访问我们的 Propfolio Solutions 开发者主页,了解扩展套件。
摘要
客户评价
5 | 100 % | |
4 | 0 % | |
3 | 0 % | |
2 | 0 % | |
1 | 0 % |