

FinTracker
指标
14 下载
版本 1.0, May 2026
Windows 版、Mac 版
5.0
评价:1
注册日期 21/02/2025
466.3M
交易量
180.83K
盈利点数
26
销售
7.43K
免费安装
说明
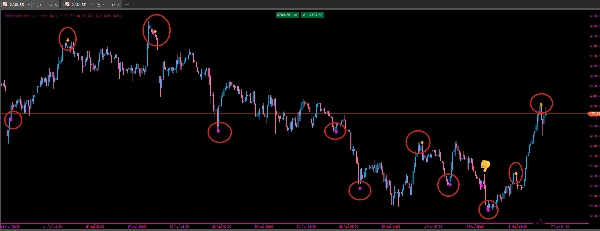
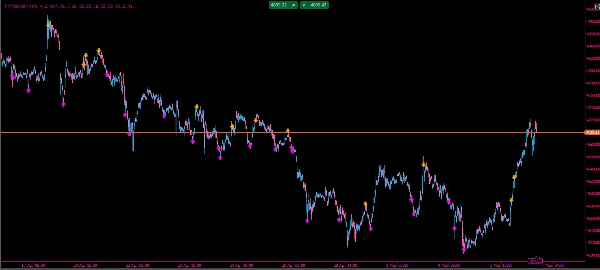
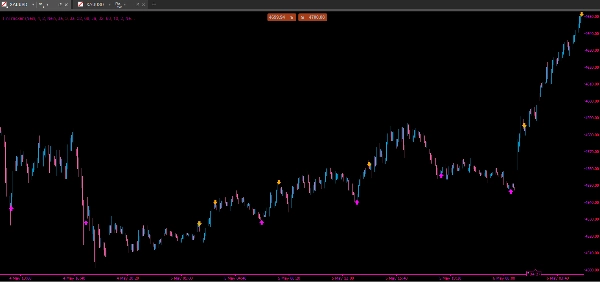
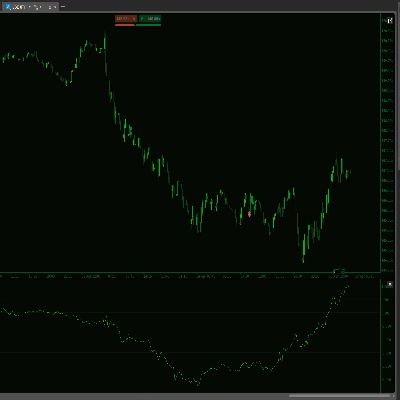
该指标结合了交易者动态指数(TDI)的核心逻辑与“鲨鱼鳍”和“极限交叉”信号的高级模式识别。它通过应用于RSI的自定义布林带样式波动带来跟踪市场波动性,当RSI线穿透并重新进入这些波动区域时,识别高概率的反转点。
主要特点
- TDI核心逻辑: 使用10周期RSI和动态波动带来可视化市场情绪和强度。
- 鲨鱼鳍检测: 识别RSI突破波动带后迅速反转的快速“尖峰”,提示潜在的耗尽点。
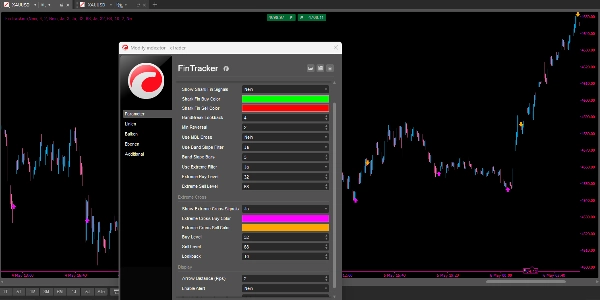
- 极限交叉信号: 标记发生在超买或超卖水平(例如,高于68或低于32)的交叉。
- 多层过滤: 包含波段斜率和“市场基线”(MBL)交叉的可选过滤器以减少噪音。
- 实时提醒: 集成图表上的视觉箭头、控制台日志记录和可选弹出通知,支持实时交易。
为了最大化FinTracker指标的胜率,强烈建议通过市场结构的视角来观察信号,而不是孤立地交易它们。以下是有效实施的专业建议:
策略建议
- HTF(高时间框架)一致性: 始终使交易与主导趋势保持一致。如果H4图表呈现多头趋势,优先考虑M15或H1图表上的鲨鱼鳍买入信号。逆势交易HTF趋势会显著增加被止损的风险。
- MBL(市场基线)过滤: 使用黄色MBL(中心线)作为“动量门”。如果RSI随后突破MBL,确认多头动量实际回归,则鲨鱼鳍买入信号更强。
- 波动性意识: 当波动带扩展时,鲨鱼鳍信号最为可靠。在“挤压”(窄波段)中,市场通常处于区间震荡,容易出现假突破。等待宽波段的明确“穿透”以获得最佳效果。
- 背离验证: 寻找“隐藏背离”以确认趋势延续,或“常规背离”以识别反转。如果价格创出更低低点,但FinTracker形成更高的鲨鱼鳍买入信号,反转概率极高。
- 风险管理: 将止损设置在鲨鱼鳍“尖峰”形成的近期价格波动高点或低点稍外侧。目标风险回报比至少为1:2,一旦RSI突破MBL,开始移动止损。
摘要
AI summary
FinTracker is a technical indicator that enhances the Traders Dynamic Index (TDI) by integrating advanced pattern recognition to identify rapid market reversals. It applies custom Bollinger-style volatility bands to a 10-period RSI, detecting key signals such as "Shark Fin" spikes—where the RSI breaks out of and quickly re-enters volatility bands—and "Extreme Cross" events, which are RSI crossovers occurring at overbought or oversold levels (above 68 or below 32). The indicator includes multi-layer filtering options, such as band slope and Market Base Line (MBL) crosses, to reduce noise and improve signal quality. Real-time alerts are provided via chart arrows, console logs, and optional pop-up notifications. For effective use, it is recommended to align signals with higher time frame trends, use the MBL as a momentum confirmation tool, consider volatility band expansion for reliability, and validate signals with divergence analysis. Risk management guidelines suggest placing stop losses beyond recent swing highs or lows and targeting a minimum risk-to-reward ratio of 1:2. FinTracker supports spotting key reversal points through momentum and volatility analysis, aiding traders in timing entries within the context of market structure.
指标配置
指标分类
支撑与阻力
输出类型
信号
数据要求
仅 K 线
支持的信号
背离
反转
客户评价
5.0
评价:1
5 | 100 % | |
4 | 0 % | |
3 | 0 % | |
2 | 0 % | |
1 | 0 % |
客户评价
May 27, 2026
One of the best indicator I've used so far I've tried dozens of indicators over the years and this one stands out. It keeps things simple without losing accuracy. Works great across multiple assets — forex, crypto, and indices.
讨论
常见问答
Key Levels
RSI
Liquidity Grab
cTrader Store 提供的所有产品,包括交易机器人、指标和插件,均由第三方开发者提供,仅供信息参考和技术访问之用。cTrader Store 并非经纪商,不提供投资建议、个人推荐或任何未来业绩保证。




























价格
注册日期 21/02/2025
466.3M
交易量
180.83K
盈利点数
26
销售
7.43K
免费安装