
Penerangan
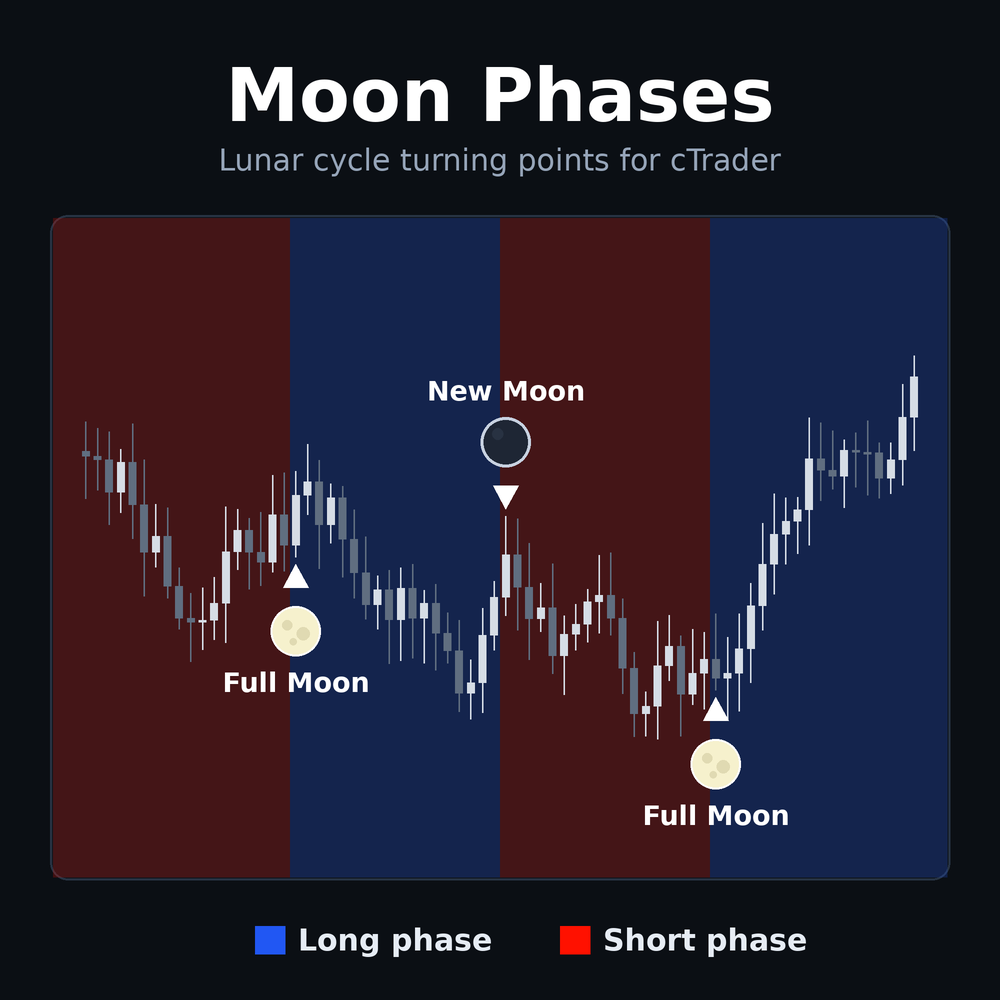
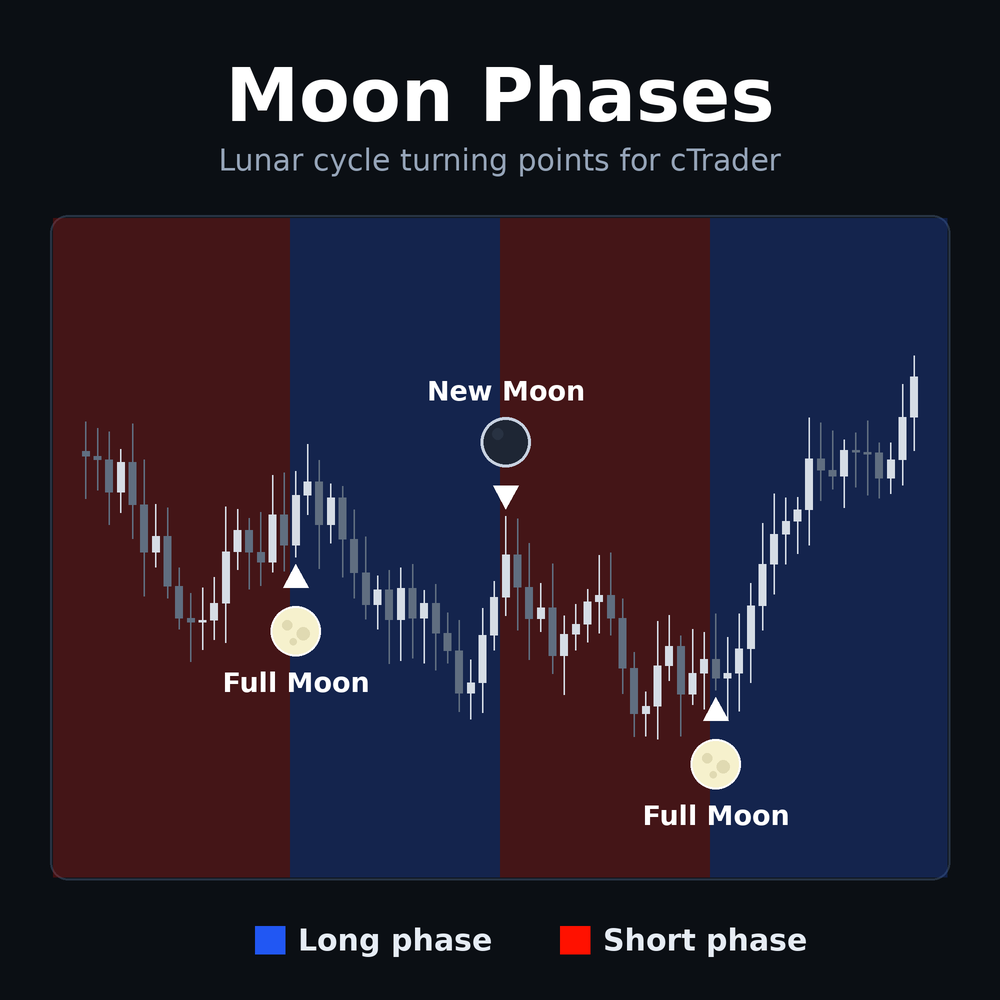
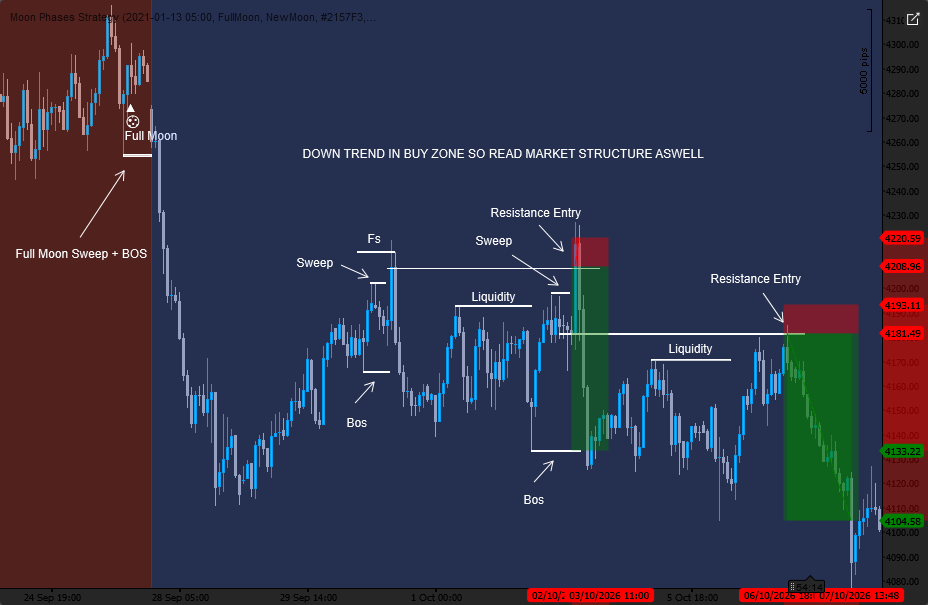
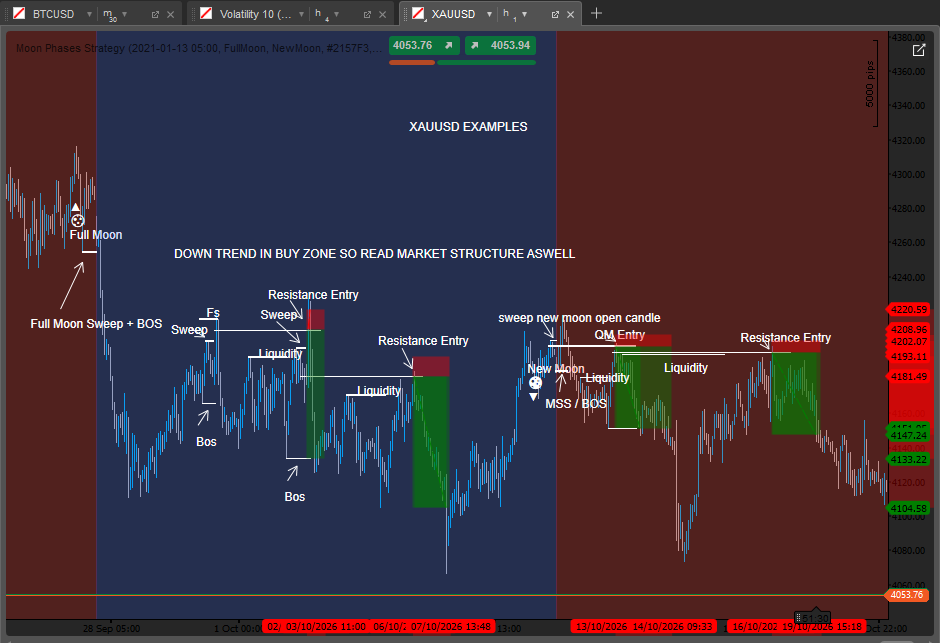
Moon Phases is a time-based cycle indicator for cTrader. It follows the 29.53-day lunar cycle and splits your chart into blue and red phases. Each time the phase flips, it marks the bar with the moon, a label and an arrow.
What it analyses
- It works from the calendar, not from price patterns. Each bar’s date and time is used to work out where it falls in the lunar cycle.
- The phase changes at a new moon or a full moon, depending on your settings.
- Optionally, the Higher Moon and Lower Moon modes compare the close at the last two moon events to decide the phase.
How to read it
- A blue background is the long phase. A red background is the short phase.
- A ▲ arrow with a moon and label below the bar marks a flip to blue.
- A ▼ arrow with a moon and label above the bar marks a flip to red.
- With the default settings, blue starts at the Full Moon and red starts at the New Moon.
- The moons stay fixed on the bar where the flip happened. They don’t move when you scroll or zoom.
Key settings
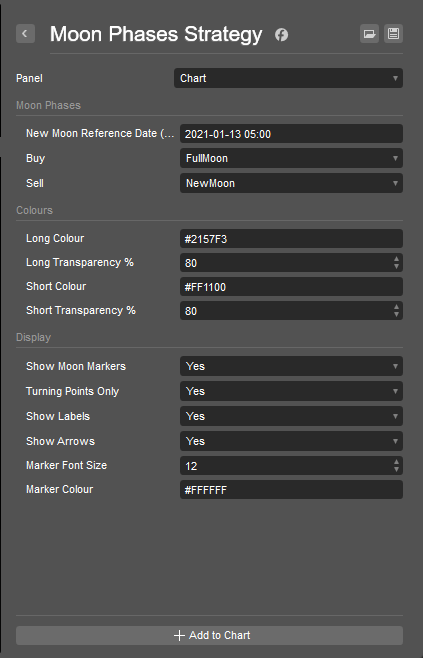
- New Moon Reference Date (UTC): the starting point of the cycle.
- Buy / Sell: choose New Moon, Full Moon, Higher Moon or Lower Moon to decide when the phase flips.
- Long and Short colour and transparency.
- Show Moon Markers, Turning Points Only, Show Labels and Show Arrows.
- Marker font size and marker colour.
Typical use
- Spot cycle turning points on any symbol and timeframe.
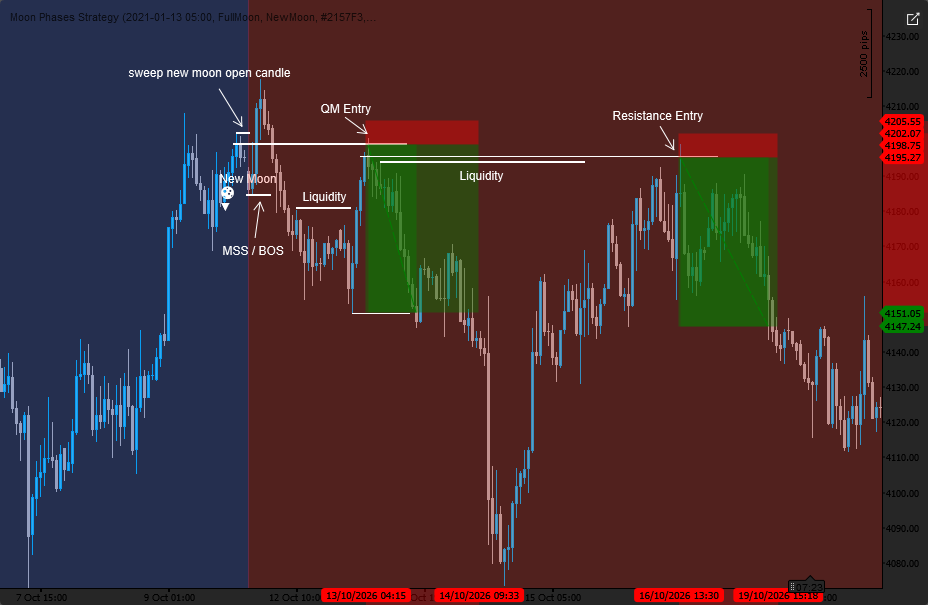
- Scroll back through history and see how price behaved around each flip.
- Use the phases as a timing filter alongside your own strategy.
Best suited for
- Traders who like cycle or time-based analysis and want it on the chart.
- Any experience level, since the indicator is simple to read.
Limitations and notes
- It does not place trades or give advice. It only draws on the chart.
- The phases come from the calendar only. They don’t consider price action, news or volatility, so test them on your own symbols before relying on them.
- On the daily timeframe, a moon can land one bar earlier or later depending on when your broker’s day starts.
- In Higher Moon and Lower Moon mode, the marker on the current bar can change until that bar closes.
- It’s a visual tool, and nothing here guarantees results.
Ringkasan
Profil indikator
Kategori indikator
Corak
Jenis output
Visualisasi
Keperluan data
Bar sahaja
Isyarat yang disokong
Pembalikan
Perbincangan
Ulasan pelanggan
0.0
Ulasan: 0
Ulasan pelanggan
Belum ada ulasan untuk produk ini. Anda sudah mencuba produk tersebut? Jadilah yang pertama untuk berkongsi pendapat anda!
Soalan Lazim
Supertrend
Liquidity Grab
Produk yang tersedia melalui cTrader Store, termasuk bot dagangan, indikator dan plugin, disediakan oleh pembangun pihak ketiga dan diberikan akses untuk tujuan maklumat dan teknikal sahaja. cTrader Store bukan broker dan tidak memberikan nasihat pelaburan, syor peribadi atau sebarang jaminan prestasi masa hadapan.
Lebih banyak produk daripada penulis ini
Harga
1
Jualan