
说明
你是否难以在交易开始时确定市场的正确方向?Daily Bias Candles & Levels Indicator 完全自动化你的每日分析。
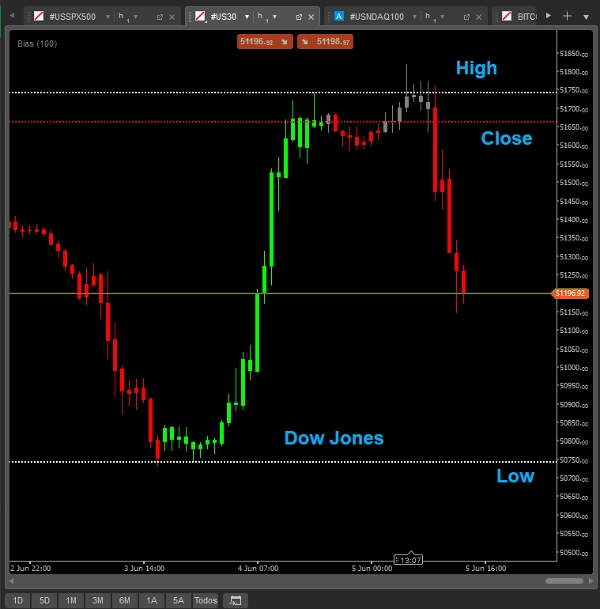
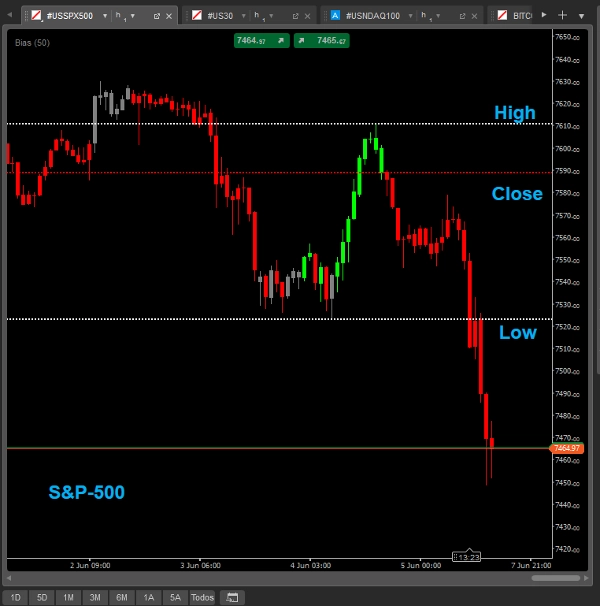
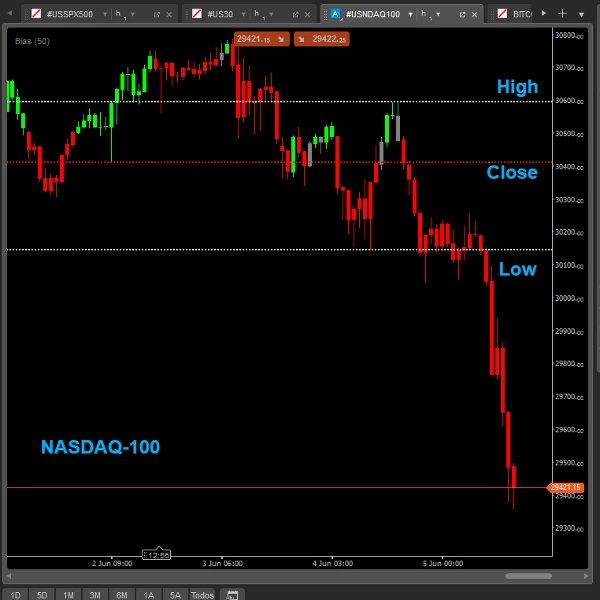
该算法数学计算前一交易日任意资产的最高价 (High)、最低价 (Low) 和 收盘价 (Close)。基于这些关键水平,指标准确界定市场处于上涨延续区、下跌延续区、回调阶段或盘整阶段。
为了让你在交易时不失焦点,指标实时为蜡烛图着色。这会即时提醒你当前价格是在关键水平之上还是之下,使你能够执行与当天真实机构偏向相符的策略。
区域和蜡烛图映射如何工作?
- 上涨延续区 (Bullish Extension): 当价格突破并强势站稳在前高之上时,蜡烛图显示自定义颜色。是时候寻找向上的扩展了!
- 下跌延续区 (Bearish Extension): 当价格低于前低时,蜡烛图显示自定义颜色。非常适合跟随大规模卖盘冲击。
- 回调阶段 / 盘整区间: 当价格被困在前高/前低与前收盘价之间时,显示中性或警示颜色。保护你避免在肮脏的积累区或市场陷阱中交易。
优化你的交易计划,避免在市场错误一方操作,跟随聪明资金的流动。立即下载你的版本!
摘要
AI summary
Bias_Ctrader is a trading indicator designed to automate daily market bias analysis by calculating the previous session's High, Low, and Close prices for any asset. It visually colors candles in real time based on these key levels to indicate market phases: bullish continuation when price breaks above the prior High, bearish continuation when price falls below the prior Low, and neutral or warning colors during retracement or sideways ranges between these levels. This color-coded system helps traders quickly identify whether the market is trending upward, downward, or consolidating, supporting alignment with institutional market bias. The indicator is applicable across various assets and integrates key concepts such as market structure, order blocks, supply and demand zones, and liquidity grabs. It provides visual cues directly on price charts to assist in decision-making without requiring manual calculation of prior session levels.
指标配置
指标分类
趋势
输出类型
可视化
过滤器
数据要求
仅 K 线
支持的信号
趋势强度
反转
触及水平位
客户评价
0.0
评价:0
客户评价
该产品尚无评价。已经试过了?抢先告诉其他人!
讨论
常见问答
Supertrend
Imbalance
Order Block
Market Structure
Supply & Demand
Liquidity Grab
Support & Resistance
cTrader Store 提供的所有产品,包括交易机器人、指标和插件,均由第三方开发者提供,仅供信息参考和技术访问之用。cTrader Store 并非经纪商,不提供投资建议、个人推荐或任何未来业绩保证。
该作者的其他作品

















价格
注册日期 10/03/2026
2
销售