
说明
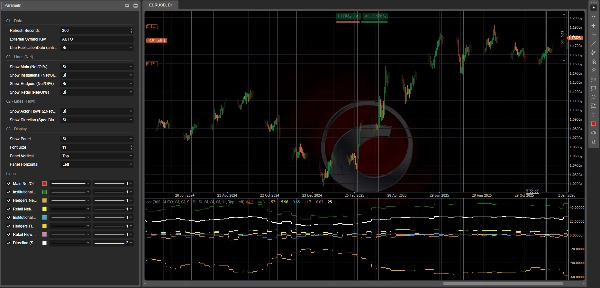
📊 COT 指标历史专业版 — 参与者流动 + 方向(机构 / 套期保值者 / 零售)
CotIndicatorHistoryPro 直接将高级的交易者持仓报告(COT)读取显示在您的图表上,清晰地按市场参与者分类(机构、套期保值者/商业、零售)。
它不仅显示 每个参与者的持仓位置(主要是多头/空头),还显示 他们当前的操作(增加多头或空头),并附加一个合成的 方向 线以突出当前的偏向。
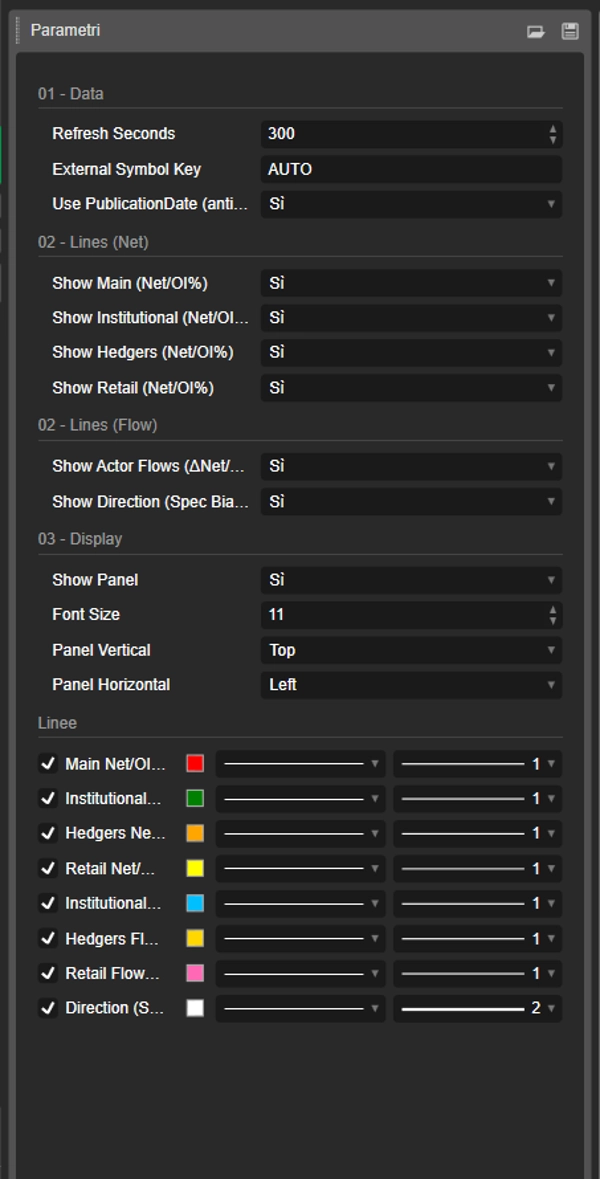
该指标从 安全的 JSON 数据源(历史 + 输出) 加载数据集,并安全地对齐到图表上(使用 PublicationDate 的防前瞻选项)。
🗓️ 每周数据更新(周五 21:00)
COT 数据集 每周五 21:00(欧洲/罗马时间)更新,得益于专门的自动化流程:
一个复杂的处理脚本执行计算,并 将更新后的数值发布到指标使用的 JSON 数据源(如果安装了相关的 cBot 生态系统,也会使用该数据)。
✅ 指标本身会根据您的 刷新秒数 设置在平台上自动刷新,并在新数据发布后立即显示最新的每周数据。
✅ 您将获得的内容(线条 + 面板)
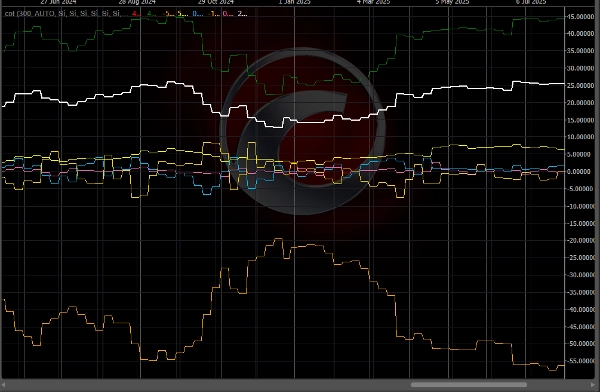
🔥 “流动”线(3 个参与者) — Δ净头寸/持仓量百分比
这些线表示 净头寸的周环比变化,并以持仓量进行归一化:
- 🔵 机构流动(Δ净头寸/持仓量百分比)
- 🟡 套期保值者 / 商业流动(Δ净头寸/持仓量百分比)
- 💗 零售流动(Δ净头寸/持仓量百分比)
📌 如何解读:
- 高于 0 ⇒ 该参与者正在 增加净多头(增加多头和/或回补空头)
- 低于 0 ⇒ 该参与者正在 增加净空头(增加空头和/或减少多头)
- 绝对值越大(例如 ±1.5%,±3%) ⇒ 持仓变化越强烈且更有意义
🧭 “方向”线 — 投机偏向净头寸/持仓量百分比
- ⚪ 方向(投机偏向)净头寸/持仓量百分比 总结了当前的“投机”方向(机构 + 零售的平均值,如有需要则使用备用数据)。
📌 如何解读:
- > 0 ⇒ 投机偏向 多头
- < 0 ⇒ 投机偏向 空头
- ≈ 0 ⇒ 持平 / 中性 阶段
🧩 信息面板(完整上下文)
内置面板显示:
- 📄 报告日期 / 发布日期
- 📌 持仓量 + 周环比 变化
- 🎯 文本信号(如果 OUTPUT 中可用)
- 针对每个参与者:
-
- 偏向(主要是多头 / 空头 / 持平),基于 净头寸
- 净头寸/持仓量百分比
- 流动(Δ净头寸/持仓量百分比)
- 周环比 Δ多头 / Δ空头 / Δ净头寸,以了解 持仓变化的方式
🧠 如何解读(简单实用)
✅ 流动 vs 偏向(关键区别)
- 流动 = 他们当前的操作(增加多头或空头)
- 偏向 = 他们整体的持仓方向(主要是多头或空头)
示例:
- 机构 偏向多头 + 正向流动 ⇒ 他们仍在加仓多头
- 机构 偏向多头 + 负向流动 ⇒ 减少多头 / 可能的仓位轮换
🚦 典型交易场景
✅ 场景 A — 趋势确认
- 方向 > 0
- 机构流动 > 0
➡️ 多头压力一致:通常是延续形态。
✅ 场景 B — 潜在反转(聪明资金 vs 零售)
- 机构流动 > 0 而零售流动 < 0
➡️ 零售卖出/做空,机构买入:可能的积累阶段。
(相反情况 = 可能的分配阶段)
✅ 场景 C — 套期保值者作为“警示”
- 套期保值者处于极端水平(净头寸/持仓量远离中性)+ 强烈流动
➡️ 可能的超买区 / 激进套期保值(通常作为警告比直接入场信号更好)。
✅ 场景 D — 市场“加仓”(突破风险)
- 强烈流动 + 持仓量周环比上升
➡️ 新仓位进入:延续行情的概率通常增加。
⚡ 10 秒阅读流程
- 检查 方向:多头(>0)还是空头(<0)
- 检查 机构流动:确认还是背离?
- 检查 零售流动:确认还是相反?
- 检查 持仓量周环比:扩张还是平仓?
✅ 支持的符号 + 关键图例(JSON 符号键)
该指标可以分析 JSON 数据源中可用的任何工具(OUTPUT 中的字段 data[].symbol)。
如何选择正确的工具
- 外部符号键 = AUTO 👉 自动使用图表符号(并去除“.”之后的任何后缀,例如
US2000.ecn→US2000)。 - 如果您的经纪商使用不同的符号名称 👉 手动设置 外部符号键 为 准确的 JSON 键(不区分大小写)。
当前数据源中的键(示例快照:reportDate 2026-02-17,publicationDate 2026-02-20)
- 外汇:
AUDUSD,EURUSD,GBPUSD,USDMXN - 指数:
US100,US2000,DOW30,VIX - 商品/金属/农产品:
BRENT,WTI,COPPER,CORN,WHEAT,XAU(黄金),XAG(白银) - 加密货币:
BTC,ETH
📌 如果您在图表上看不到数值:
- 确认图表符号与 JSON 键匹配
- 手动设置 外部符号键(例如,
ETH,US2000) - 检查面板中的 报告/发布日期,确认加载了最新数据集
⚙️ 备注
- 支持更安全的对齐方式,使用 使用 PublicationDate(防前瞻) ✅
- 线条和面板可以单独启用或禁用。
📌 免责声明:仅为信息性指标,不构成财务建议。COT 数据为每周更新,应结合趋势、关键水平和波动性进行分析。
摘要
The indicator sources data from a secured JSON feed updated every Friday at 21:00 (Europe/Rome time) and aligns it on the chart using publication dates to prevent lookahead bias. Users can view flow lines for each actor, a direction line indicating overall market bias, and an info panel detailing report dates, open interest, net positions, and weekly changes.
It supports a wide range of instruments including Forex pairs (e.g., EURUSD, GBPUSD), indices (e.g., US100, DOW30), commodities (e.g., Brent, Gold), and cryptocurrencies (BTC, ETH). Symbol selection can be automatic or manually set to match feed keys.
Typical use cases include trend confirmation, spotting potential reversals by comparing smart money and retail flows, hedger activity alerts, and breakout risk assessment based on open interest changes. The indicator is informational and designed to complement other technical analysis tools.
客户评价
5 | 50 % | |
4 | 50 % | |
3 | 0 % | |
2 | 0 % | |
1 | 0 % |


!["[Stellar Strategies] Smart ADX" 标识](https://cdn.ctrader.com/image/webp/af13b084-b6f6-41db-b7bc-c7e688b57b05_36929)


