
说明
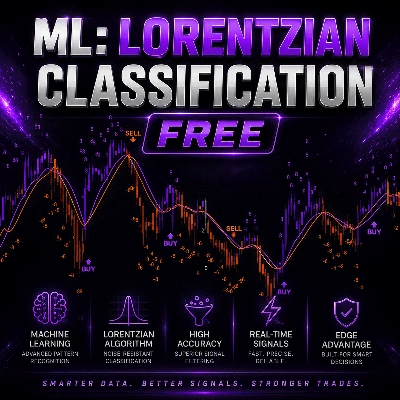
机器学习:洛伦兹分类
一种近似的k近邻分类器,使用洛伦兹距离而非欧几里得距离来衡量市场状态之间的相似性。洛伦兹几何压缩了异常值和波动冲击的影响,因此历史类比在不同市场状态下仍然具有可比性。每个柱线都与按时间顺序间隔的邻居集合进行评分,所得预测通过Nadaraya-Watson核回归确认后发出信号。
核心引擎
- 近似最近邻搜索,邻居之间至少间隔4根柱线,避免相邻价格行为的过度采样
- 洛伦兹距离度量,最多支持5个特征维度
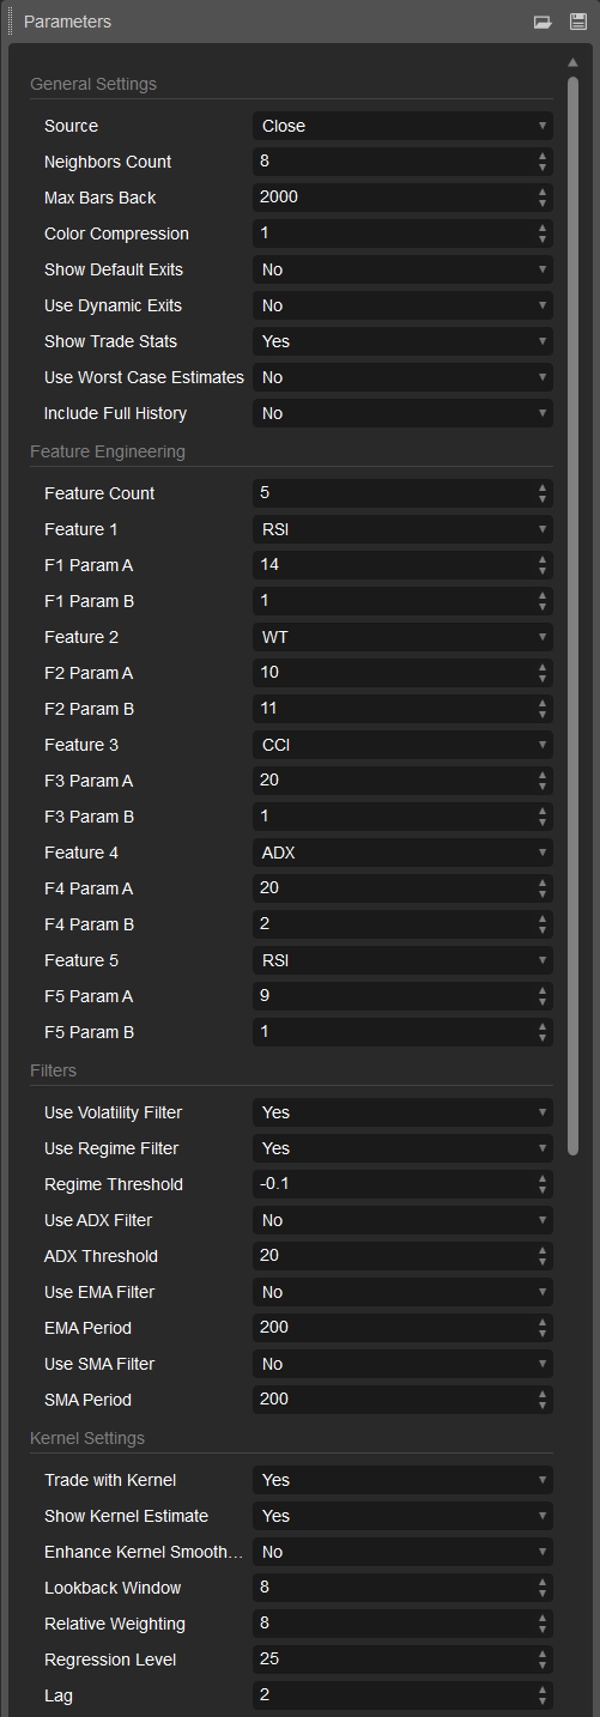
- 邻居数量可调,范围1至100(默认8)
- 最大回溯柱线数可达完整图表历史,并提供包含完整历史模式的选项
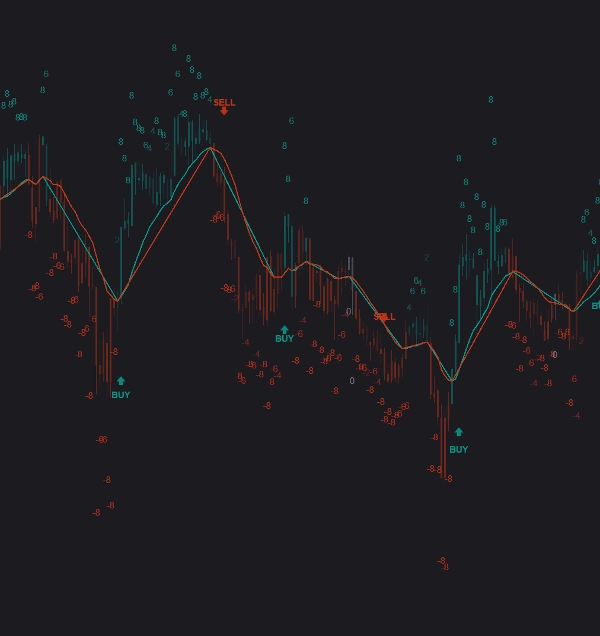
- 每根柱线上打印预测值,范围从-N到+N,其中N为邻居数量
特征工程
- 五个可配置特征槽,每个可选择归一化RSI、WaveTrend、CCI或ADX
- 每个特征独立设置长度和平滑参数
- 特征数量可从5减少到2,以获得更快、更粗糙的模型
过滤器
- 波动率过滤器(近期与历史ATR对比)
- 基于卡尔曼式自适应斜率估计的状态过滤器,阈值可调
- 配置阈值的ADX过滤器
- 可选的EMA和SMA趋势过滤器
- 核过滤器:仅在核估计方向发出信号
核回归
- 主估计使用有理二次核,交叉检测使用高斯核
- 可调回溯窗口、相对权重、回归水平和交叉滞后
- 增强平滑模式,减少颜色转换并增加入场信号
- 核线以两种颜色绘制,分别表示看涨和看跌
信号与提醒
- 买入和卖出箭头配粗体文本标签,位置根据ATR调整,适应不同工具
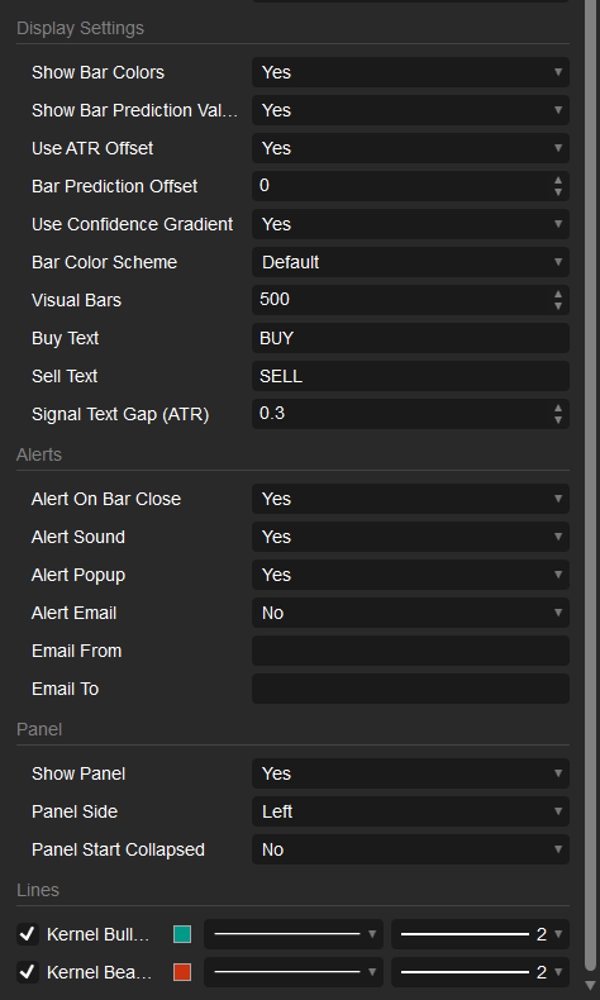
- 标签文本和间距可配置,视觉效果适配任何图表风格
- 可选退出标记,固定为4根柱线或通过核逻辑动态调整
- 新信号时的声音、弹窗和邮件提醒
- 默认在柱线收盘时提醒,或选择柱内提醒以加快反应
- 每根柱线仅提醒一次,附加指标时无提醒爆发
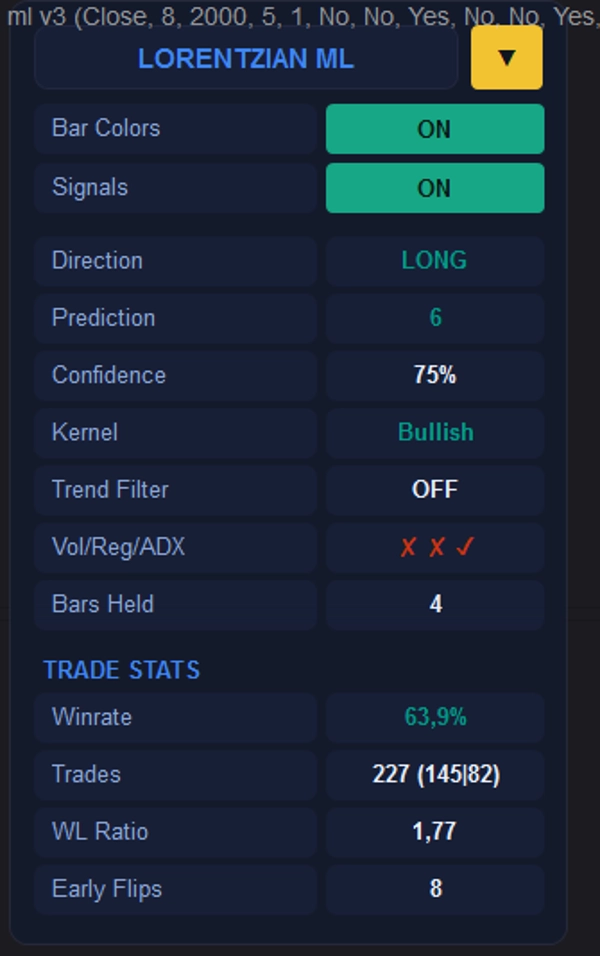
图表面板
- 半透明暗色面板,可从标题栏折叠
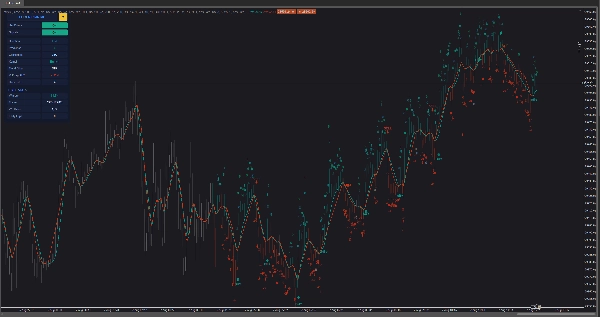
- 实时方向、预测值、置信度、核状态、趋势过滤状态及过滤通过/失败
- 交易统计块:胜率、交易次数、盈亏比及早期信号反转
- 柱线着色和信号可见性的切换按钮
显示
- 根据预测强度对柱线着色,支持渐变或纯色模式
- 置信度渐变,根据模型信念调整颜色强度
- 可调视觉范围,保持大型图表响应速度
注意事项
- 交易统计是用于调校特征和过滤器的校准辅助工具。它们不是回测,不考虑点差、佣金、滑点或仓位大小。请在交易前在正式回测中验证任何配置。
- 与原版一样,模型实时评估正在形成的柱线。数值在柱线收盘后确定。若只需确认信号,请使用“柱线收盘时提醒”。
- 推荐起点:5分钟至4小时周期,默认8个邻居,全部5个特征,启用波动率和状态过滤器。
基于jdehorty的开源洛伦兹分类指标,遵循Mozilla公共许可证2.0发布。
该指标为技术分析工具,不构成财务建议,任何配置的历史表现不代表未来结果。
摘要
Key features include:
- Adjustable neighbors count (1–100) with a minimum 4-bar spacing to avoid oversampling.
- Up to five configurable feature inputs selectable from normalized RSI, WaveTrend, CCI, or ADX, each with independent length and smoothing parameters.
- Multiple filters including volatility (ATR-based), regime (Kalman-style adaptive slope), ADX threshold, EMA/SMA trend filters, and kernel direction filter.
- Kernel regression using rational quadratic and Gaussian kernels with adjustable parameters and enhanced smoothing options.
- Visual BUY/SELL alerts with ATR-scaled positioning, customizable labels, optional exit markers, and sound, popup, and email alerts triggered on bar close or intrabar.
- A collapsible on-chart panel displaying live prediction values, confidence, kernel and trend states, filter results, and trade statistics (win rate, trade count, win/loss ratio).
- Bar coloring by prediction strength with adjustable gradient or solid modes and visual range settings.
The indicator evaluates forming bars in real time, with values settling at bar close. It supports detailed feature and filter tuning but does not perform backtesting or account for trading costs. Recommended for use on 5-minute to 4-hour timeframes with default settings including eight neighbors and all five features enabled.
客户评价
讨论
常见问答
该作者的其他作品















价格
