

说明
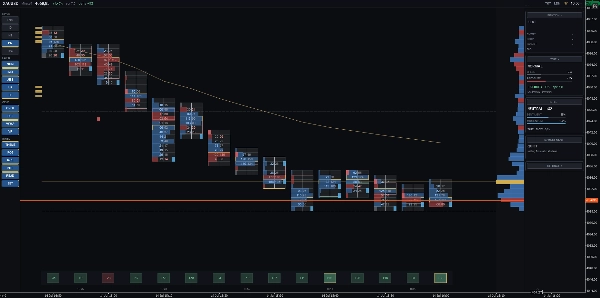
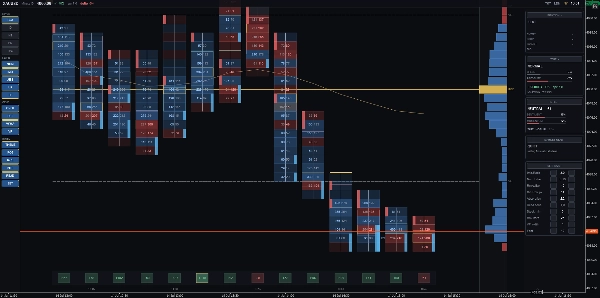
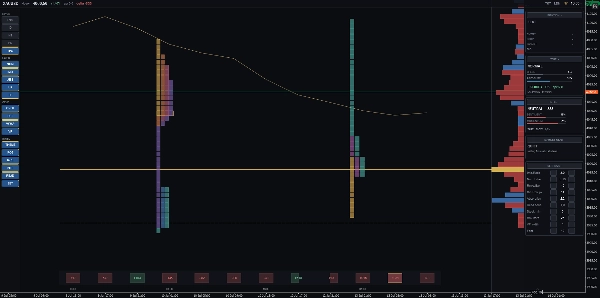
DRX OrderFlux 将逐笔数据转换为清晰的订单流图,显示动量停滞的位置以及拍卖反复测试的价格水平。它绘制的内容 - 买卖盘足迹:按价格水平分割,买卖活动并列显示。五种视图:买卖盘、Delta、热力图、轮廓和TPO。 - 不平衡和堆叠墙:突出显示成交量不平衡超过您选择比例的价格水平。 - 吸收和未完成拍卖:检测未能推动价格进一步上涨的高活动,以及关闭不完整的极端水平。 - 单笔打印:突出显示在快速拒绝前短暂访问的价格水平。 - 成交量轮廓:显示在固定于右侧边缘的面板中,包含POC、VAH、VAL和会话VWAP。 - TPO时间块:每个会话一个轮廓,带有专用POC,按时间顺序颜色编码。 - Delta通道:位于底部,单一对齐以便直接比较。 - 市场读取:在明显拒绝或成交量突破时出现的不显眼信号。阈值根据每个标的自动自校准。 - 交易带面板:测量当前交易带速度与平均水平的对比,并提供流动性警告。 - 持仓面板:显示入场、止损、目标、盈亏和风险回报比,带有清晰的图表线。布局设置自动保存,按标的和时间框架区分。使用方法 兼容所有标的和时间框架。适合日内分析(M1至H1)。可与DRX Footprint Lower配合使用,提供专用的成交量、Delta和累计Delta面板。关于数据 cTrader逐笔数据包括时间、买价和卖价报价,但不传输交易量数据。DRX OrderFlux 测量逐笔活动而非成交合约量,遵循标准外汇逐笔成交量方法。市场深度数据依赖经纪商数据源。大多数差价合约账户提供有限的聚合水平;因此,流动性警告集成在交易带面板中,而非订单簿阶梯。
摘要
AI summary
DRXFootprint is an order flow indicator designed for use on any symbol and timeframe, with optimal performance on intraday charts (M1 to H1) for instruments like gold, indices, oil, and major forex pairs. It transforms tick data into a detailed order flow chart, displaying bid and ask activity side by side at each price level within bars, effectively breaking down each bar into its constituent buy and sell actions.
Key features include five distinct views: Bid x Ask footprint, Delta, Heatmap, Volume Profile, and TPO (Time Price Opportunity). The indicator highlights imbalances and stacked walls where one side dominates, absorption zones where heavy activity fails to move price, unfinished auctions, and single prints—levels touched only once. The volume profile panel shows POC (Point of Control), VAH (Value Area High), VAL (Value Area Low), and session VWAP. TPO profiles per session are color-coded to compare auction shapes across days.
Additional tools include a delta lane for comparing bars, a market read panel that signals price rejections or breaks with volume and delta confirmation, a tape panel showing tape speed and liquidity warnings, and a position panel displaying entry, stop, target, PnL, pips, and risk-reward ratio. Layouts are saved per symbol and timeframe for consistent workspace setup.
DRXFootprint uses cTrader tick data, measuring tick activity rather than traded contract volume, and includes liquidity warnings based on broker depth of market data.
Key features include five distinct views: Bid x Ask footprint, Delta, Heatmap, Volume Profile, and TPO (Time Price Opportunity). The indicator highlights imbalances and stacked walls where one side dominates, absorption zones where heavy activity fails to move price, unfinished auctions, and single prints—levels touched only once. The volume profile panel shows POC (Point of Control), VAH (Value Area High), VAL (Value Area Low), and session VWAP. TPO profiles per session are color-coded to compare auction shapes across days.
Additional tools include a delta lane for comparing bars, a market read panel that signals price rejections or breaks with volume and delta confirmation, a tape panel showing tape speed and liquidity warnings, and a position panel displaying entry, stop, target, PnL, pips, and risk-reward ratio. Layouts are saved per symbol and timeframe for consistent workspace setup.
DRXFootprint uses cTrader tick data, measuring tick activity rather than traded contract volume, and includes liquidity warnings based on broker depth of market data.
指标配置
客户评价
0.0
评价:0
客户评价
该产品尚无评价。已经试过了?抢先告诉其他人!
讨论
常见问答
Aggressive
BOS
Imbalance
Order Block
Volume
CHOCH
DOM Tools
cTrader Store 提供的所有产品,包括交易机器人、指标和插件,均由第三方开发者提供,仅供信息参考和技术访问之用。cTrader Store 并非经纪商,不提供投资建议、个人推荐或任何未来业绩保证。
猜您喜欢
















价格

注册日期 08/07/2026