

Mô tả
# 🚀 Chỉ số Trượt Kinetics (KSI) – Công cụ Phân tích Áp lực Thị trường & Thanh khoản Nâng cao
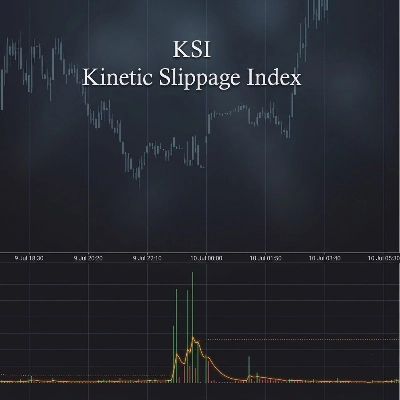
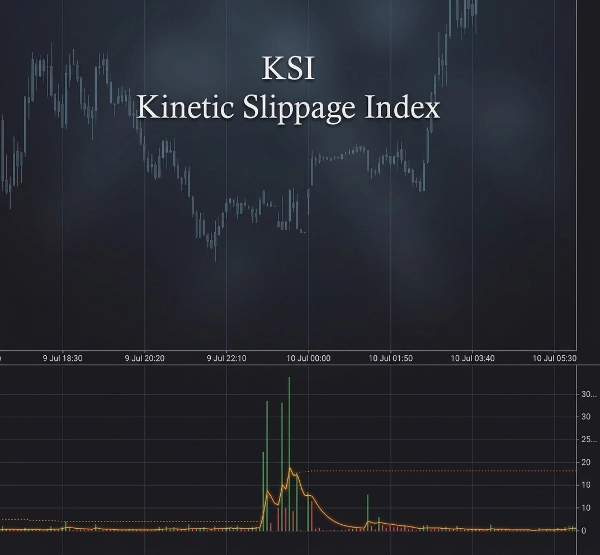
Khám phá những hiểu biết sâu sắc hơn về thị trường với **Chỉ số Trượt Kinetics (KSI)** — một chỉ báo giao dịch mạnh mẽ được thiết kế để xác định các chuyển động giá bất thường, mất cân bằng khối lượng và các sự kiện thanh khoản tiềm năng trước khi chúng trở nên rõ ràng trên biểu đồ.
Được xây dựng cho các nhà giao dịch phân tích **cấu trúc thị trường, hành vi khối lượng, biến động và hoạt động tổ chức**, KSI kết hợp sự mở rộng phạm vi và động lực khối lượng để đo lường các điều kiện thị trường bất thường.
## 🔥 Tính năng chính
✅ **Tính toán Chỉ số Trượt Kinetics**
* Đo lường mối quan hệ giữa chuyển động giá và khối lượng giao dịch.
* Phát hiện các tình huống giá di chuyển không tương xứng so với hành vi khối lượng bình thường.
* Giúp xác định các áp lực thanh khoản tiềm năng, hoạt động thị trường tích cực và động lực bất thường.
✅ **Phát hiện Đỉnh Điểm Thích ứng**
* Tự động tính toán các mức đỉnh điểm động dựa trên hành vi thị trường gần đây.
* Sử dụng phân tích độ lệch thống kê để làm nổi bật các sự kiện thị trường cực đoan.
* Thích ứng với các điều kiện biến động thay đổi mà không cần điều chỉnh thủ công liên tục.
✅ **Cảnh báo Đỉnh Điểm Thời gian Thực 🚨**
* Nhận thông báo khi xảy ra sự phân kỳ khối lượng/phạm vi bất thường.
* Giúp các nhà giao dịch nhanh chóng xác định các điều kiện bứt phá tiềm năng, các đợt thu hút thanh khoản hoặc áp lực thị trường đột ngột.
✅ **Phân tích Khối lượng & Dòng chảy 📊**
* Theo dõi khối lượng hiện tại so với trung bình EMA của nó.
* Làm nổi bật khi hoạt động giao dịch cao bất thường.
* Bao gồm phân tích delta tích lũy để hình dung áp lực mua và bán.
✅ **Xác nhận Đường tín hiệu 📈**
* Tính toán tín hiệu mượt mà giúp xác định sự thay đổi trong động lực KSI.
* Hình ảnh biểu đồ cột màu xanh/lá giúp dễ dàng đọc các chuyển động áp lực thị trường.
## 🕒 Thông minh Phiên Giao dịch
KSI bao gồm theo dõi phiên thị trường tự động:
🌏 Phiên Châu Á
🇬🇧 Phiên London
🇺🇸 Buổi sáng New York
☕ Giờ ăn trưa New York
🌆 Buổi chiều New York
Màn hình killzone tích hợp giúp các nhà giao dịch hiểu khi nào thanh khoản và biến động thường cao hơn.
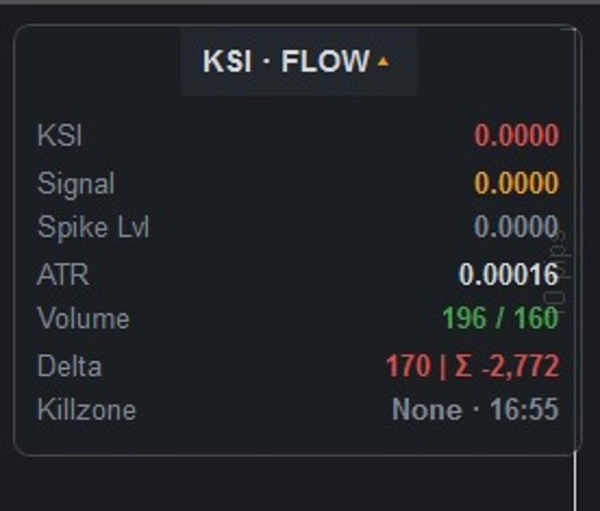
## 📌 Bảng Thông tin Chuyên nghiệp
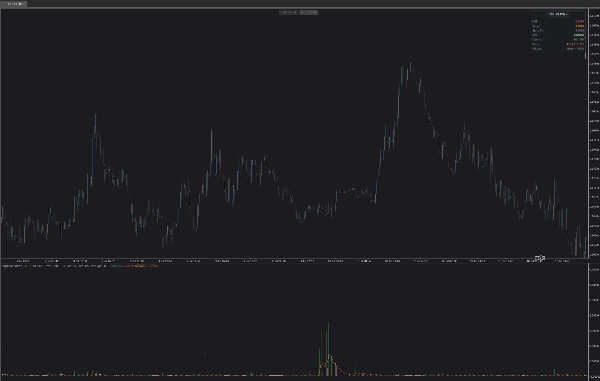
Bảng điều khiển tích hợp cung cấp cái nhìn tổng quan rõ ràng ngay trên biểu đồ của bạn:
📍 Giá trị KSI hiện tại
📍 Mức tín hiệu
📍 Ngưỡng đỉnh điểm thích ứng
📍 Đọc biến động ATR
📍 Khối lượng hiện tại so với khối lượng trung bình
📍 Delta & delta tích lũy
📍 Phiên giao dịch đang hoạt động / killzone
Bảng có thể được:
* ✅ Đặt ở bất kỳ góc nào của biểu đồ
* ✅ Thu gọn hoặc mở rộng
* ✅ Điều chỉnh với độ mờ tùy chỉnh
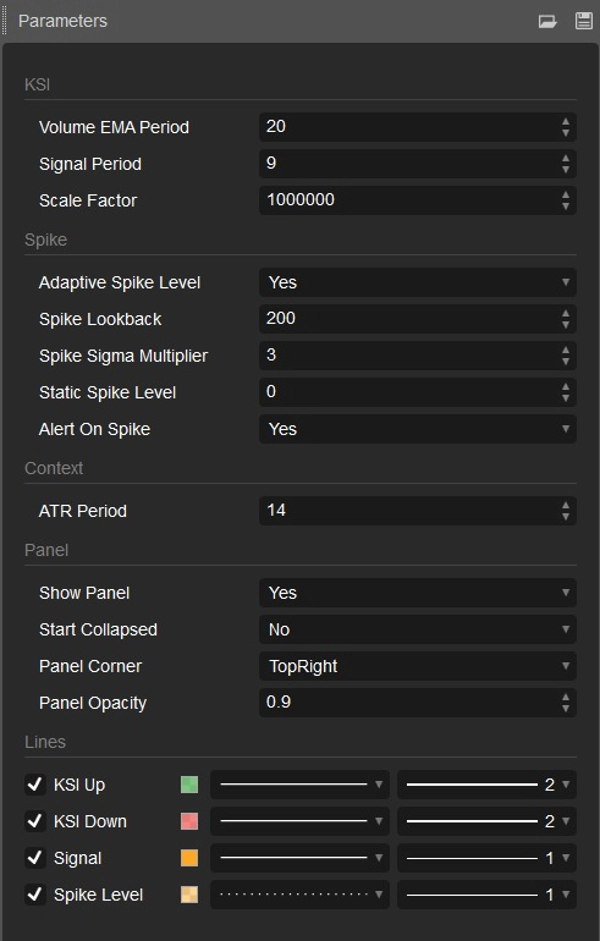
## ⚙️ Cài đặt Tùy chỉnh
Tinh chỉnh KSI cho bất kỳ phong cách giao dịch nào:
🔧 Chu kỳ EMA Khối lượng
🔧 Chu kỳ Tín hiệu
🔧 Hệ số Tỷ lệ
🔧 Phát hiện đỉnh điểm thích ứng hoặc cố định
🔧 Chu kỳ nhìn lại đỉnh điểm
🔧 Bộ nhân độ nhạy đỉnh điểm
🔧 Chu kỳ ATR
🔧 Cài đặt giao diện bảng
## 🎯 Thiết kế cho
✔ Nhà giao dịch Forex
✔ Nhà giao dịch Hợp đồng tương lai
✔ Nhà giao dịch Tiền điện tử
✔ Nhà giao dịch lướt sóng
✔ Nhà giao dịch trong ngày
✔ Nhà phân tích cấu trúc thị trường
✔ Nhà giao dịch tìm kiếm xác nhận dựa trên khối lượng
## 💡 Cách các Nhà giao dịch Sử dụng KSI
KSI có thể giúp xác định:
⚡ Hoạt động thị trường bất thường
⚡ Áp lực bứt phá tiềm năng
⚡ Phân kỳ khối lượng-giá
⚡ Các sự kiện thanh khoản
⚡ Thay đổi động lực
⚡ Cơ hội giao dịch biến động cao
Kết hợp KSI với chiến lược hiện có của bạn để có cái nhìn rõ ràng hơn về **khi nào thị trường di chuyển bình thường — và khi có điều gì đó bất thường xảy ra.**
📈 Giao dịch thông minh hơn. Hiểu áp lực thị trường. Phát hiện hoạt động ẩn với Chỉ số Trượt Kinetics.
Tóm tắt
The indicator includes volume and flow analysis by comparing current volume to its exponential moving average (EMA) and incorporates cumulative delta analysis to visualize buying and selling pressure. A smooth signal line and histogram help confirm changes in KSI momentum, making shifts in market pressure easier to interpret.
KSI tracks major trading sessions—Asia, London, and New York (AM, Lunch, PM)—highlighting periods of higher liquidity and volatility. A professional information panel displays key metrics such as current KSI value, signal level, adaptive spike threshold, ATR volatility, volume comparisons, delta values, and active trading sessions. This panel is customizable in position, size, and opacity.
Settings allow fine-tuning of volume EMA period, signal period, scale factor, spike detection parameters, ATR period, and panel appearance. KSI is suitable for forex, futures, and crypto traders, including scalpers, day traders, and market structure analysts seeking volume-based confirmation and insights into unusual market activity, breakout pressure, liquidity events, and momentum changes.
Thảo luận
Đánh giá của khách hàng
5 | 0 % | |
4 | 100 % | |
3 | 0 % | |
2 | 0 % | |
1 | 0 % |
Câu hỏi thường gặp
Sản phẩm khác của tác giả này















![Logo "[Hamster-Coder] Moving Average MTF"](https://cdn.ctrader.com/image/webp/b11b98b1-194d-4b8e-b00e-d611826ad159_31226)
Giá