
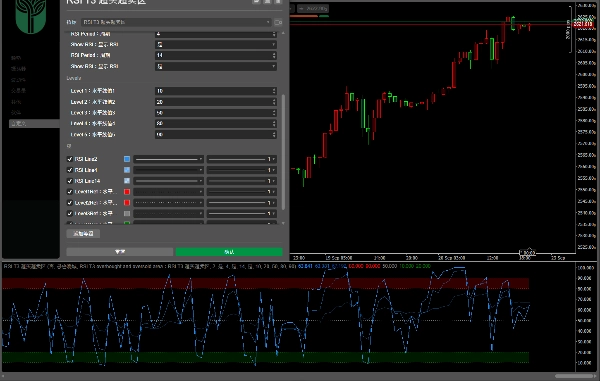
RSI T3 overbought and oversold area
指标
版本 1.0, Sep 2024
Windows 版、Mac 版
4.0
评价:1
说明
带超买超卖区域的三参数 RSI
(参数和超买超卖区域可以独立调整;每条周期线可以单独开关),便于观察多周期共振:
• 趋势一致性:
短期、中期和长期周期的 RSI 朝同一方向移动。如果短期 RSI 保持在中长期 RSI 之上,表示看涨趋势;否则,表示看跌趋势。
• 背离与反转:
当价格创出新高/新低,但短期 RSI 未能同步,且中长期 RSI 走弱/回升时,预示可能出现回调/反弹。
• 超买超卖确认:
当单周期 RSI 进入超买或超卖区域时,应结合其他周期进行判断;如果多个周期同时进入超买或超卖区域,信号更为可靠。
• 周期共振:
当多周期 RSI 发出相同信号(例如均突破 50 中轴线)时,趋势延续或反转的概率更高,有助于决策。
带超买超卖区域的三参数 RSI
(可自主调整参数与超买超卖区域,支持单独开关各周期线),便于观察多周期共振:
•趋势一致性:
短、中、长周期 RSI 同向运行,短周期在中长周期上方为多头趋势;反之则为空头趋势。
•背离与反转:
价格创新高 / 低但短周期 RSI 未同步,且中长周期 RSI 走弱 / 回升,提示可能回调 / 反弹。
•超买超卖确认:
单周期超买超卖时,需结合其他周期判断;多周期同时超买超卖,信号更可靠。
•周期共振:
多周期 RSI 同发信号(如均突破 50 中轴线),趋势延续或反转的概率更高,可辅助决策。
摘要
AI 摘要
The RSI T3 Overbought and Oversold Area indicator is a customizable technical analysis tool featuring a three-parameter Relative Strength Index (RSI) with adjustable overbought and oversold zones. Users can independently set parameters and enable or disable each RSI cycle line (short, medium, long), facilitating multi-cycle resonance observation. Key functionalities include:
- Trend Consistency: Identifies bullish or bearish trends based on the relative positions of short-, medium-, and long-cycle RSIs.
- Divergence and Reversal Signals: Detects potential pullbacks or rallies when price movements diverge from short-cycle RSI behavior while medium- and long-cycle RSIs weaken or recover.
- Overbought/Oversold Confirmation: Enhances signal reliability by combining overbought or oversold conditions across multiple RSI cycles.
- Cycle Resonance: Highlights stronger trend continuation or reversal probabilities when multiple RSI cycles simultaneously signal, such as crossing the 50 midline.
This indicator supports detailed momentum analysis by integrating multi-timeframe RSI data, aiding traders in decision-making through comprehensive trend and reversal insights.
指标配置
客户评价
4.0
评价:1
5 | 0 % | |
4 | 100 % | |
3 | 0 % | |
2 | 0 % | |
1 | 0 % |
讨论
常见问答
Fibonacci
ZigZag
Supertrend
Fair Value Gap
RSI
ATR
MACD
Bollinger
VWAP
cTrader Store 提供的所有产品,包括交易机器人、指标和插件,均由第三方开发者提供,仅供信息参考和技术访问之用。cTrader Store 并非经纪商,不提供投资建议、个人推荐或任何未来业绩保证。
该作者的其他作品


价格
注册日期 11/09/2024
4
销售
58
免费安装