
说明
该指标分析每个交易日的第一个4小时蜡烛图,以确定每日价格区间。它识别前一个4小时蜡烛图的最高价、最低价和收盘价——这三个关键水平是机构交易者和算法在每个交易日开始时大量参考的。它还分析15分钟的波动结构以确定当前的市场偏向。该指标可用于任何市场,优选指数。
如何解读信号和视觉元素
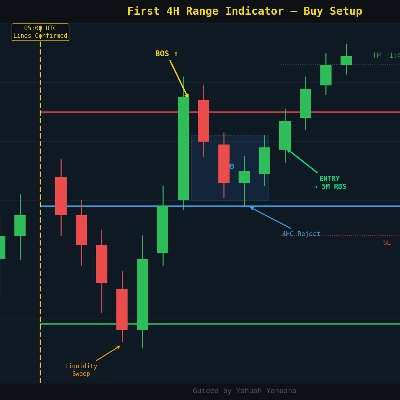
- 红色水平线 — 第一个4小时蜡烛图的最高价。作为每日区间的上边界和潜在阻力位
- 绿色水平线 — 第一个4小时蜡烛图的最低价。作为下边界和潜在支撑
- 蓝色水平线(4HC) — 前一个4小时蜡烛图的收盘价,标记新一天开始时的价格位置。通常作为中间区间的流动性水平
- 金色垂直线 — 标记所有水平确认的确切柱线,便于查看区间设定时间
- 15分钟结构面板 — 根据最近的波动高点和低点显示看涨、看跌或盘整偏向,图表上标有HH/HL/LH/LL标签
所有线条在第一个4小时蜡烛图收盘时立即变为实线并锁定。确认后不会重绘或移动。
关键设置和参数
- 最大历史天数 — 控制显示多少过去的水平线天数
- 显示日开盘时的4小时收盘价 — 切换蓝色4HC线的显示开关
- 显示日初金色线 — 切换金色垂直线的显示
- 显示垂直标记 — 在区间边界显示有界刻度标记以供视觉参考
- 15分钟结构偏向 — 切换波动标签和偏向面板(仅限5分钟图表)
- 波动回溯/波动计数 — 控制结构检测的灵敏度
- 每个元素的颜色、粗细和线条样式完全自定义
典型使用场景和交易情境
- 利用高点和低点作为每日区间,在关键时段(伦敦/纽约开盘)寻找反转或突破
- 将4HC水平作为中间目标或汇合入场点
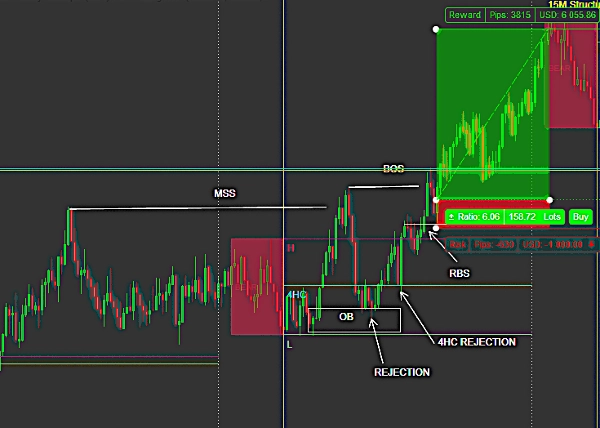
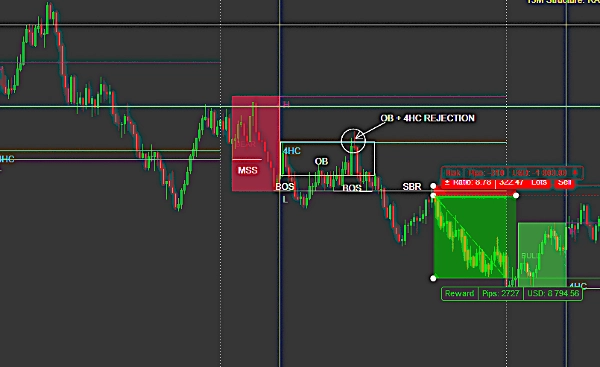
- 结合SMC、ICT或CRT框架进行高概率交易设置
- 在进行5分钟入场前检查15分钟偏向面板以确保结构一致性
该指标适合的人群
适合中级到高级的日内交易者,使用每日开盘区间作为结构参考。特别适合使用智能资金概念(SMC)、ICT或类似方法论的交易者。适用于所有时间框架,但与5分钟或1分钟图表配合使用入场精度最佳。
重要限制和使用说明
- 水平线仅在当天第一个4小时蜡烛图收盘后显示——该蜡烛图形成过程中不显示任何水平线
- 水平线出现的确切时间取决于您的经纪商的4小时蜡烛图对齐。在Deriv平台上,第一个4小时蜡烛图于UTC时间01:00开盘,05:00收盘
- 15分钟结构偏向面板仅限于5分钟图表
- 为获得最佳滚动性能,若出现延迟,请禁用金色垂直线或减少最大历史天数
摘要
AI summary
This indicator analyzes the first 4-hour candle of each trading day to define a daily price range by marking its high, low, and close levels. These levels serve as key reference points commonly used by institutional traders and algorithms at the start of each session. The indicator also evaluates 15-minute swing structure to determine current market bias, displaying Bullish, Bearish, or Ranging conditions with labeled swing highs and lows. Visual elements include a red line for the 4H candle high (potential resistance), green line for the low (potential support), blue line for the previous 4H candle close (mid-range liquidity), and a gold vertical line marking when these levels are confirmed. All lines are fixed once the first 4H candle closes, with no repainting. Customizable settings allow control over history length, visibility of lines and markers, and swing detection sensitivity. Typical use cases involve identifying daily range breakouts or reversals during key market open times, using the 4H close as a target or confluence level, and combining with Smart Money Concepts or related frameworks for trade entries. The indicator is suited for intermediate to advanced intraday traders, especially those using 5-minute or 1-minute charts for precise entries. It supports any market but is optimized for indices. Levels appear only after the first 4H candle closes, with timing dependent on broker candle alignment.
指标配置
指标分类
市场结构(SMC)
输出类型
过滤器
数据要求
仅 K 线
客户评价
0.0
评价:0
客户评价
该产品尚无评价。已经试过了?抢先告诉其他人!
讨论
常见问答
Key Levels
BOS
Liquidity Grab
cTrader Store 提供的所有产品,包括交易机器人、指标和插件,均由第三方开发者提供,仅供信息参考和技术访问之用。cTrader Store 并非经纪商,不提供投资建议、个人推荐或任何未来业绩保证。
该作者的其他作品


!["High-Low Divergence [Iridio Capital]" 标识](https://cdn.ctrader.com/image/webp/10a9e91b-243a-43f6-bbfe-7376bad5a214_61554)
















价格
1
销售