
Opis
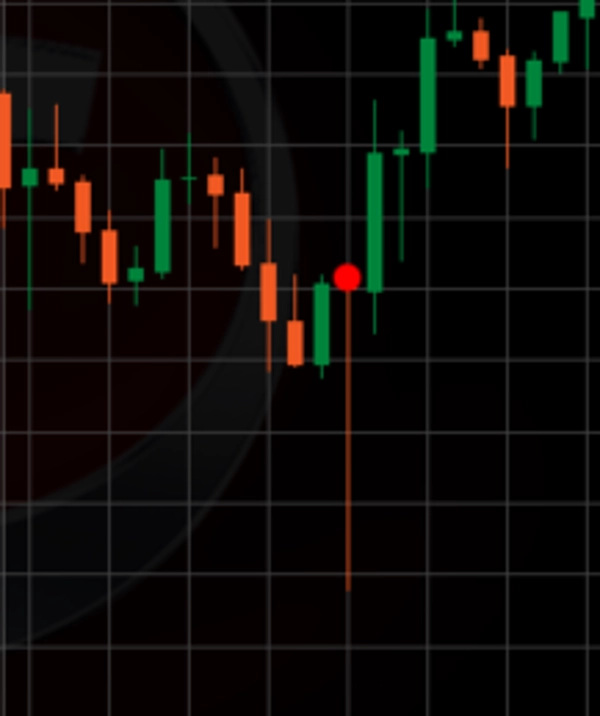
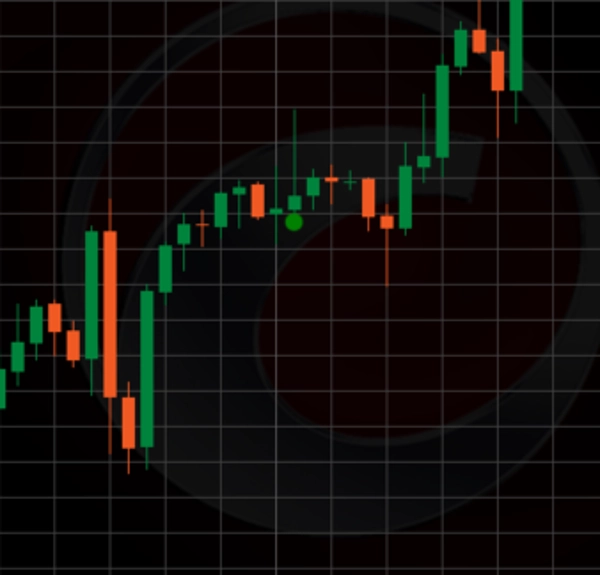
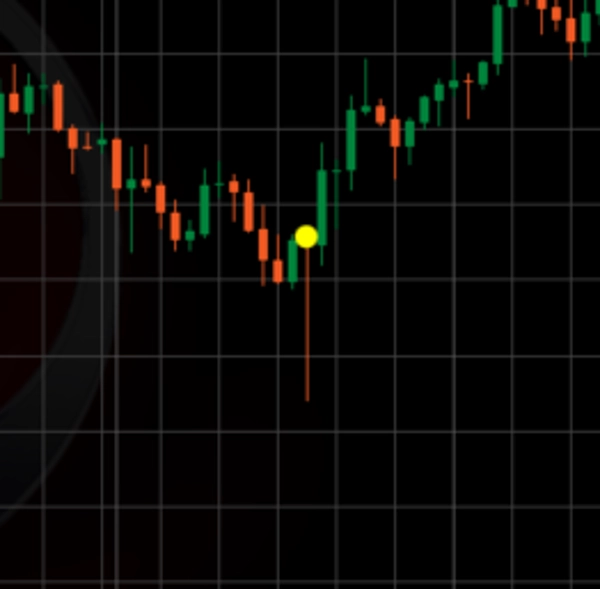
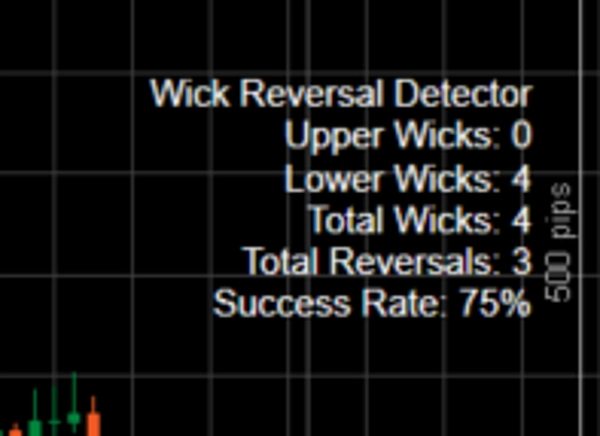
Wskaźnik Long Wick to potężne narzędzie analizy technicznej stworzone dla cTrader, które koncentruje się na identyfikowaniu świec z niezwykle długimi knotami — górnymi lub dolnymi — w stosunku do wielkości korpusu i średniego zakresu świecy. Podkreśla te knoty na wykresie jako potencjalne punkty odwrócenia, gdzie rynek mógł odrzucić wyższe ceny (dla górnych knotów, sugerując odwrócenie niedźwiedzie) lub niższe ceny (dla dolnych knotów, sugerując odwrócenie bycze). Wskaźnik wykorzystuje kombinację mnożnika progu knota, minimalnego stosunku knota do korpusu oraz filtrującej trend prostej średniej kroczącej (SMA), aby odfiltrować szumy i skupić się na istotnych wzorcach odrzucenia ceny. Każdy wykryty knot jest oznaczony kółkiem (zielonym dla górnych knotów, czerwonym dla dolnych knotów, jeśli potwierdzone jako odwrócenia, lub żółtym, jeśli nie), a dane statystyczne (np. całkowita liczba knotów, odwrócenia i wskaźnik skuteczności) są wyświetlane na wykresie dla łatwego śledzenia.
Jak używać w handlu:
- Identyfikacja okazji do odwrócenia: Użyj wskaźnika, aby zauważyć długie knoty pojawiające się na kluczowych poziomach wsparcia lub oporu albo przeciwko dominującemu trendowi (np. długi dolny knot w trendzie spadkowym jako potencjalne bycze odwrócenie). Solidne zielone lub czerwone kółko wskazuje potwierdzone odwrócenie na podstawie ruchu cenowego w okresie lookforward, co stanowi sygnał do rozważenia wejścia w transakcję w przeciwnym kierunku (np. kupno przy czerwonym dolnym knocie odwrócenia, sprzedaż przy zielonym górnym knocie odwrócenia).
- Potwierdzenie innymi narzędziami: Połącz wskaźnik Long Wick z innymi wskaźnikami technicznymi (np. RSI, MACD lub liniami wsparcia/oporu), aby potwierdzić sygnały odwrócenia i uniknąć fałszywych alarmów, szczególnie na niestabilnych rynkach.
- Zarządzanie ryzykiem: Ustaw zlecenia stop-loss poza ekstremum knota (np. poniżej minimum dla byczego odwrócenia), aby chronić się przed możliwością niepowodzenia odwrócenia, oraz ustal poziomy take-profit na podstawie pobliskich wsparć/oporów lub stosunku ryzyka do zysku (np. 1:2).
- Monitorowanie wskaźnika skuteczności: Regularnie sprawdzaj wyświetlany wskaźnik skuteczności, aby ocenić efektywność wskaźnika w czasie i odpowiednio dostosować swoją strategię.
Dostosowywanie parametrów dla najlepszych rezultatów:
- Okres lookback (domyślnie: 5): Określa liczbę świec używanych do obliczenia średniego zakresu świecy. Krótszy okres (np. 3-10) sprawia, że wskaźnik jest bardziej czuły na ostatnią zmienność, idealny dla szybko zmieniających się rynków, podczas gdy dłuższy okres (np. 20-50) wygładza średnią dla warunków trendowych. Dostosuj w zależności od ram czasowych (np. niższy dla wykresów 1-minutowych, wyższy dla 1-godzinnych).
- Okres lookforward (domyślnie: 15): Ustawia liczbę świec do potwierdzenia odwrócenia. Krótszy okres (np. 5-10) pasuje do szybkich strategii skalpowania, podczas gdy dłuższy okres (np. 15-30) jest lepszy dla swing tradingu, aby uchwycić dłuższe odwrócenia. Zwiększ, jeśli zauważysz zbyt wiele żółtych oznaczeń, gdzie odwrócenia występują później.
- Mnożnik progu knota (domyślnie: 1.3): Mnoży średni zakres świecy, aby ustalić minimalną długość knota. Niższe wartości (np. 1.0-1.5) wykrywają więcej knotów (przydatne na rynkach o niskiej zmienności), podczas gdy wyższe wartości (np. 2.0-3.0) filtrują tylko najbardziej znaczące knoty (lepsze na rynkach o wysokiej zmienności). Dostosuj, aby zrównoważyć czułość i jakość sygnału.
- Okres trendu (SMA) (domyślnie: 21): Określa długość SMA do filtrowania trendu. Krótszy okres (np. 10-20) reaguje na krótkoterminowe trendy, podczas gdy dłuższy okres (np. 50-100) odpowiada trendom długoterminowym. Dostosuj do swojego horyzontu handlowego i warunków rynkowych.
- Minimalny stosunek knota do korpusu (domyślnie: 3): Ustawia minimalny stosunek długości knota do wielkości korpusu. Niższy stosunek (np. 2-3) obejmuje więcej świec z umiarkowanymi knotami, podczas gdy wyższy stosunek (np. 4-5) koncentruje się na świecach z bardzo wyraźnymi knotami. Zwiększ, aby uzyskać bardziej rygorystyczne sygnały odwrócenia, zmniejsz, aby mieć więcej okazji.
- Tolerancja odwrócenia (pipsy) (domyślnie: 5): Pozwala na tolerancję w pipsach, aby cena mogła wyjść poza ekstremum knota przed zdyskwalifikowaniem odwrócenia. Mniejsza wartość (np. 2-3) zapewnia ścisłe potwierdzenie odwrócenia, podczas gdy większa wartość (np. 5-10) uwzględnia drobne cofnięcia. Dostosuj w zależności od wartości pipsa i zmienności symbolu.
Wskazówki dotyczące optymalizacji:
- Zacznij od ustawień domyślnych i przeprowadź testy historyczne na preferowanym instrumencie i ramie czasowej.
- Na rynkach trendowych zwiększ mnożnik progu knota i minimalny stosunek knota do korpusu, aby skupić się na silniejszych sygnałach odwrócenia.
- Na rynkach bocznych obniż te parametry, aby wychwycić więcej knotów, ale połącz to z krótszym okresem lookforward, aby uniknąć późnych dyskwalifikacji.
- Regularnie przeglądaj wskaźnik skuteczności i dostosuj parametry, jeśli spadnie poniżej akceptowalnego progu (np. 70%).
Dostosowując te parametry, traderzy mogą dopasować wskaźnik Long Wick do swojej konkretnej strategii, zwiększając jego skuteczność w wykrywaniu punktów odwrócenia o wysokim prawdopodobieństwie w różnych warunkach rynkowych.
Podsumowanie
Traders can use the indicator to spot reversal opportunities at key support or resistance levels or against prevailing trends. It is recommended to confirm signals with other technical tools such as RSI or MACD and to apply risk management by placing stop-loss orders beyond wick extremes. The indicator’s parameters—including lookback and lookforward periods, wick threshold multiplier, SMA trend period, minimum wick-to-body ratio, and reversal tolerance—are adjustable to suit different market conditions and trading styles. Regular review of the success rate helps optimize performance.
Opinie klientów
5 | 0 % | |
4 | 100 % | |
3 | 0 % | |
2 | 0 % | |
1 | 0 % |


