
Opis
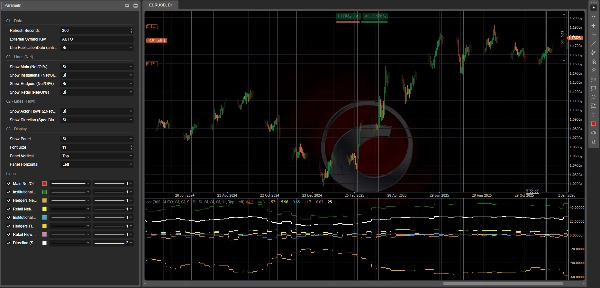
📊 COT Indicator History Pro — Przepływ Aktorów + Kierunek (Instytucjonalni / Hedgers / Detaliści)
CotIndicatorHistoryPro dostarcza zaawansowane dane Commitments of Traders (COT) bezpośrednio na wykres, z wyraźnym podziałem na uczestników rynku (Instytucjonalni, Hedgers/Komercyjni, Detaliści).
Pokazuje nie tylko gdzie każdy aktor jest pozycjonowany (przeważnie long/short), ale także co robi w danym momencie (zwiększa longi lub shorty), oraz syntetyczną linię Kierunku podkreślającą dominujące nastawienie.
Wskaźnik ładuje swój zestaw danych z zabezpieczonego źródła JSON (HISTORIA + WYJŚCIE) i bezpiecznie dopasowuje go na wykresie (opcja anty-lookahead z użyciem PublicationDate).
🗓️ Cotygodniowa aktualizacja danych (piątek 21:00)
Zestaw danych COT jest aktualizowany w każdy piątek o 21:00 (czas Europa/Rzym) dzięki dedykowanemu procesowi automatyzacji:
zaawansowany skrypt przetwarzający wykonuje obliczenia i publikuje zaktualizowane wartości do źródła JSON używanego przez wskaźnik (oraz powiązany ekosystem cBot, jeśli jest zainstalowany).
✅ Sam wskaźnik odświeża się na platformie zgodnie z ustawieniem Refresh Seconds i wyświetli nowe cotygodniowe dane zaraz po ich publikacji.
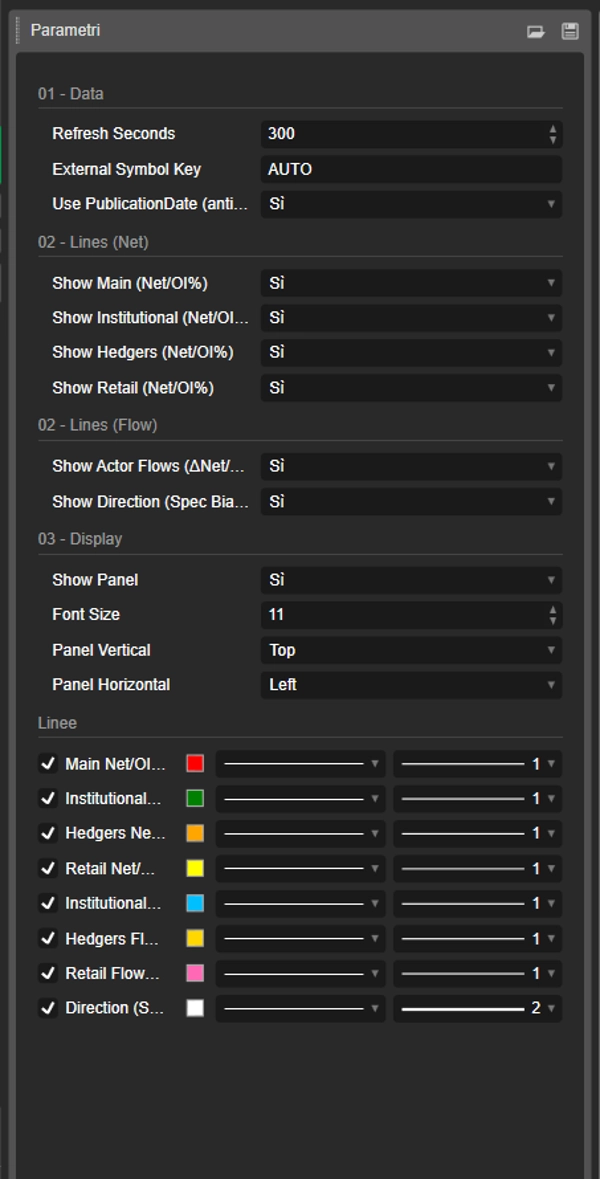
✅ Co otrzymujesz (linie + panel)
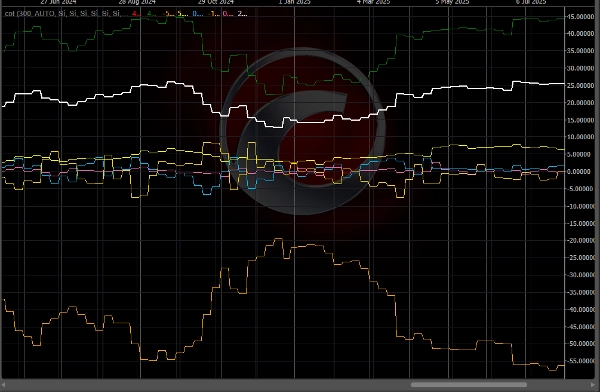
🔥 Linie „Przepływu” (3 aktorów) — ΔNet/OI%
Te linie przedstawiają zmianę netto pozycji tydzień do tygodnia, znormalizowaną przez Open Interest:
- 🔵 Przepływ Instytucjonalny (ΔNet/OI%)
- 🟡 Przepływ Hedgers / Komercyjnych (ΔNet/OI%)
- 💗 Przepływ Detalistów (ΔNet/OI%)
📌 Jak to czytać:
- Powyżej 0 ⇒ aktor zwiększa netto pozycje LONG (dodaje longi i/lub zamyka shorty)
- Poniżej 0 ⇒ aktor zwiększa netto pozycje SHORT (dodaje shorty i/lub redukuje longi)
- Większe wartości bezwzględne (np. ±1,5%, ±3%) ⇒ silniejsze i bardziej znaczące zmiany pozycji
🧭 Linia „Kierunku” — Spec Bias Net/OI%
- ⚪ Kierunek (Spec Bias) Net/OI% podsumowuje dominujący „spekulacyjny” kierunek (średnia z Instytucjonalnych + Detalistów, z zapasowym rozwiązaniem w razie potrzeby).
📌 Jak to czytać:
- > 0 ⇒ spekulacyjny nastawienie LONG
- < 0 ⇒ spekulacyjny nastawienie SHORT
- ≈ 0 ⇒ FAZA FLAT / neutralna
🧩 Panel informacyjny (pełny kontekst)
Wbudowany panel wyświetla:
- 📄 Data raportu / data publikacji
- 📌 Open Interest + zmiana WoW (tydzień do tygodnia)
- 🎯 Sygnał tekstowy (jeśli dostępny w WYJŚCIU)
- Dla każdego aktora:
-
- Nastawienie (przeważnie LONG / SHORT / FLAT) na podstawie Netto
- Net/OI%
- Przepływ (ΔNet/OI%)
- Zmiana WoW ΔLong / ΔShort / ΔNet aby zrozumieć jak zmieniła się pozycja
🧠 Jak to czytać (prosto i praktycznie)
✅ Przepływ vs Nastawienie (kluczowa różnica)
- Przepływ = co robią teraz (dodają longi lub shorty)
- Nastawienie = jak są pozycjonowani ogólnie (przeważnie long lub short)
Przykład:
- Instytucjonalne Nastawienie LONG + pozytywny Przepływ ⇒ nadal zwiększają longi
- Instytucjonalne Nastawienie LONG + negatywny Przepływ ⇒ redukcja longów / możliwa rotacja
🚦 Typowe scenariusze handlowe
✅ Scenariusz A — Potwierdzenie trendu
- Kierunek > 0
- Przepływ instytucjonalny > 0
➡️ Presja na long jest spójna: często sygnał kontynuacji.
✅ Scenariusz B — Potencjalne odwrócenie (Smart Money vs Detaliści)
- Przepływ instytucjonalny > 0 podczas gdy przepływ detaliczny < 0
➡️ Detaliści sprzedają/shortują, a instytucje kupują: możliwa akumulacja.
(Przeciwieństwo = możliwa dystrybucja)
✅ Scenariusz C — Hedgers jako „Alert”
- Hedgers na ekstremalnych poziomach (Net/OI daleko od neutralnego) + silny przepływ
➡️ Możliwa strefa nadmiaru / agresywne zabezpieczenie (często lepsze jako ostrzeżenie niż bezpośredni sygnał wejścia).
✅ Scenariusz D — „Ładowanie” rynku (ryzyko wybicia)
- Silny przepływ + wzrost Open Interest WoW
➡️ Nowe pozycje wchodzą: często rośnie prawdopodobieństwo rozszerzonych ruchów.
⚡ Rutyna czytania w 10 sekund
- Sprawdź Kierunek: LONG (>0) czy SHORT (<0)
- Sprawdź Przepływ instytucjonalny: potwierdza czy się rozbiega?
- Sprawdź Przepływ detaliczny: potwierdza czy robi odwrotnie?
- Sprawdź Open Interest WoW: ekspansja czy redukcja pozycji?
✅ Obsługiwane symbole + kluczowa legenda (klucze symboli JSON)
Wskaźnik może analizować dowolny instrument dostępny w źródle JSON (pole data[].symbol w WYJŚCIU).
Jak wybrać właściwy instrument
- Zewnętrzny klucz symbolu = AUTO 👉 automatycznie używa symbolu wykresu (usuwa dowolny sufiks po „.”, np.
US2000.ecn→US2000). - Jeśli Twój broker używa innych nazw symboli 👉 ustaw Zewnętrzny klucz symbolu na dokładny klucz JSON (bez rozróżniania wielkości liter).
Aktualne klucze w źródle (przykładowy zrzut: reportDate 2026-02-17, publicationDate 2026-02-20)
- FX:
AUDUSD,EURUSD,GBPUSD,USDMXN - Indeksy:
US100,US2000,DOW30,VIX - Surowce/Metale/Rolnictwo:
BRENT,WTI,COPPER,CORN,WHEAT,XAU(złoto),XAG(srebro) - Krypto:
BTC,ETH
📌 Jeśli nie widzisz wartości na wykresie:
- sprawdź, czy symbol wykresu odpowiada kluczowi JSON
- ustaw Zewnętrzny klucz symbolu ręcznie (np.
ETH,US2000) - sprawdź panel Data raportu / publikacji, aby potwierdzić załadowanie najnowszego zestawu danych
⚙️ Uwagi
- Obsługuje bezpieczniejsze dopasowanie z Użyj PublicationDate (anty-lookahead) ✅
- Linie i panel można włączać/wyłączać indywidualnie.
📌 Zastrzeżenie: wskaźnik informacyjny, nie porada finansowa. Dane COT są cotygodniowe i powinny być interpretowane w kontekście trendu, kluczowych poziomów i zmienności.
Podsumowanie
The indicator sources data from a secured JSON feed updated every Friday at 21:00 (Europe/Rome time) and aligns it on the chart using publication dates to prevent lookahead bias. Users can view flow lines for each actor, a direction line indicating overall market bias, and an info panel detailing report dates, open interest, net positions, and weekly changes.
It supports a wide range of instruments including Forex pairs (e.g., EURUSD, GBPUSD), indices (e.g., US100, DOW30), commodities (e.g., Brent, Gold), and cryptocurrencies (BTC, ETH). Symbol selection can be automatic or manually set to match feed keys.
Typical use cases include trend confirmation, spotting potential reversals by comparing smart money and retail flows, hedger activity alerts, and breakout risk assessment based on open interest changes. The indicator is informational and designed to complement other technical analysis tools.
Opinie klientów
5 | 50 % | |
4 | 50 % | |
3 | 0 % | |
2 | 0 % | |
1 | 0 % |


