
Opis
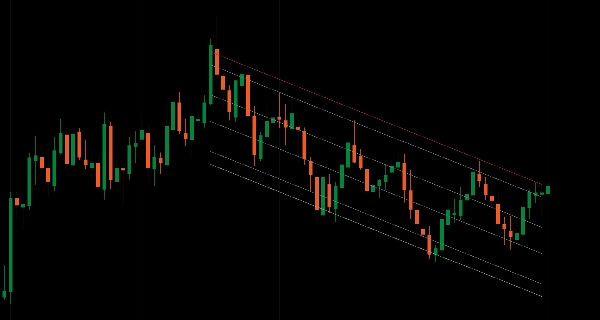
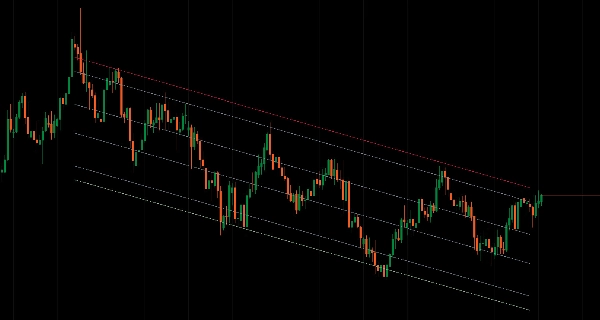
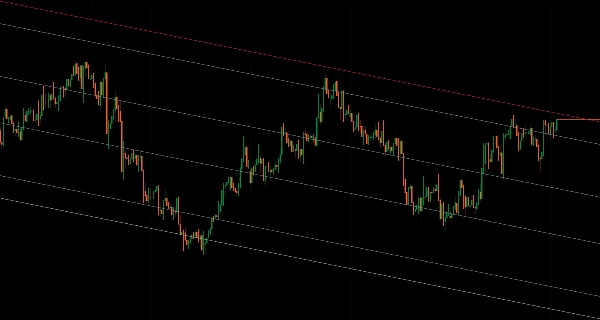
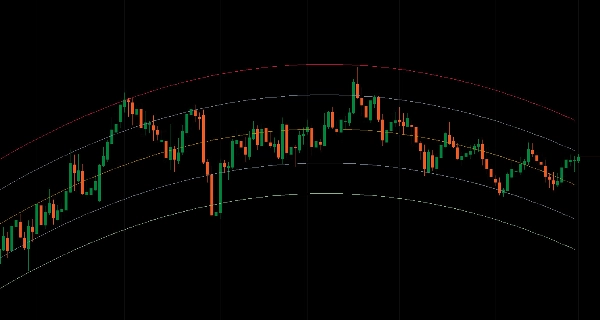
Statystyczne kanały regresji z poziomami Fibonacciego w różnych typach obliczeń, ramach czasowych i zakresach dat.
Dopasowuje linie regresji do danych cenowych za pomocą ośmiu metod (liniowa, logarytmiczna, wykładnicza, ważona, wielomianowa, ruchoma, wykładnicza ruchoma, LOWESS) z pasmami odchylenia standardowego do analizy powrotu do średniej.
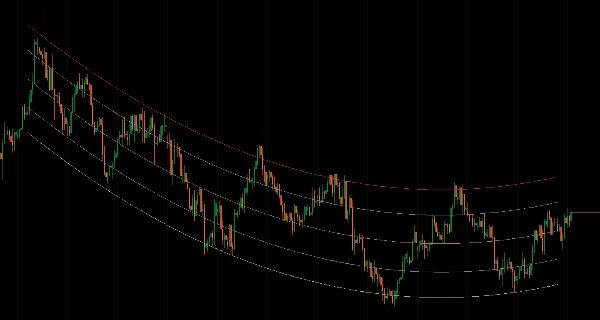
Dziewięć poziomów kanału Fibonacciego (od 0% do 100%), analiza wieloramowa na 16 okresach z interpolowanym renderowaniem, trzy tryby obliczeń (na podstawie okresu, zakres dat, MTF), kontrola stopnia wielomianu (1-5) dla zakrzywionych struktur trendu, mnożnik odchylenia standardowego do regulacji szerokości kanału, analizowanie dat i godzin z uwzględnieniem stref czasowych dla analizy zdarzeń, projekcja linii trendu do nieskończoności oraz zoptymalizowane buforowanie LRU zapewniają kompleksową analizę regresji statystycznej dla traderów celujących w strefy powrotu do średniej i zakrzywione struktury cenowe w różnych warunkach rynkowych.
CECHY
8 Typów Obliczeń Regresji
- Liniowa: Klasyczna regresja liniowa najmniejszych kwadratów
- Logarytmiczna: Regresja oparta na logarytmie naturalnym dla wykładniczych ruchów cen
- Wykładnicza: Dopasowanie krzywej wykładniczej dla przyspieszających trendów
- Ważona: Regresja liniowa z większym wagą dla ostatnich świec
- Wielomianowa: Dopasowania zakrzywione (stopień 1-5) dla trendów nieliniowych
- Ruchoma: Regresja oparta na średniej ruchomej
- Wykładnicza Ruchoma: Regresja oparta na EMA dla wygładzania trendu
- LOWESS: Lokalnie ważona regresja dla adaptacyjnego wygładzania
9 Poziomów Kanału Fibonacciego
- Pełny zakres kanału: 100% (górny), 88,6%, 76,4%, 61,8%, 50% (linia środkowa), 38,2%, 23,6%, 11,4%, 0% (dolny)
- Strefy powrotu do średniej w obrębie pasm regresji
- Precyzyjne punkty odniesienia wsparcia/oporu
- Niezależna kontrola koloru/stylu/grubości dla każdego poziomu
Analiza Wieloramowa
- Oblicz regresję na wyższym interwale, wyświetl na aktualnym wykresie
- Dostępnych 16 interwałów (od m1 do miesięcznego)
- Interpolowane wartości kanału dla płynnego renderowania na świecach
- Struktura wyższego interwału bez zmiany wykresów
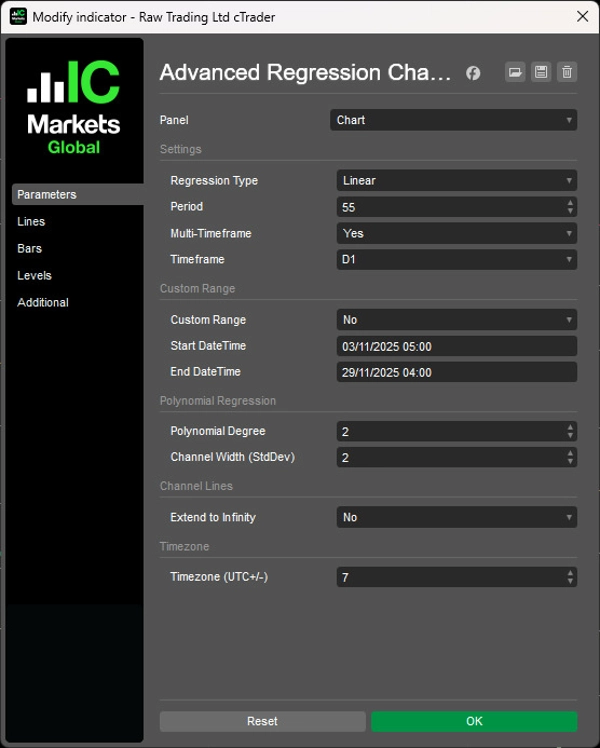
3 Tryby Obliczeń
- Na podstawie okresu: Okno przesuwne N świec (domyślnie)
- Zakres dat: Niestandardowa data/godzina rozpoczęcia i zakończenia dla konkretnych zdarzeń lub faz z analizą dat i godzin uwzględniającą strefę czasową (przesunięcie UTC+/-)
Opcje Wyświetlania Kanału
- Standardowy wynik: Wyświetl wszystkie 9 poziomów jako linie wskaźnika
- Rozciągnięcie do nieskończoności: Renderuj jako linie trendu, które projektują się w przód bez ograniczeń
- Automatyczne odświeżanie przy zmianie kolorów/stylów
- Czyste renderowanie — brak pozostałych wartości poza oknem obliczeń
Tryb Zakresu Dat
- Zdefiniuj dokładne daty rozpoczęcia/zakończenia (format dd/MM/yyyy HH:mm)
- Analizuj konkretne zdarzenia rynkowe, fazy lub struktury
- Niezależny od parametru okresu
- Konwersja strefy czasowej z lokalnego czasu użytkownika na czas serwera
Dynamiczne Obliczenia
- Aktualizacje w czasie rzeczywistym podczas formowania się nowych świec
- Zoptymalizowane buforowanie LRU z śledzeniem zakresu zmian
- Adaptacyjny rozmiar bufora w zależności od interwału
- Wyszukiwanie binarne dla szybkiego wyszukiwania zakresów dat
Kontrola Szerokości Kanału
- Mnożnik odchylenia standardowego (domyślnie 2,0)
- Szersze pasma dla ekspansji zmienności
- Węższe pasma dla rynków ograniczonych zakresem
- Spójne dla wszystkich typów regresji
Regresja Wielomianowa
- Kontrola stopnia: 1-5 (wyższy = większe zakrzywienie)
- Uchwycenie trendów nieliniowych
- Przydatna dla struktur cenowych parabolicznych lub zakrzywionych
- Powrót do liniowej przy stopniu = 1
Czyste Zarządzanie Wizualne
- Brak obliczeń na formującej się świecy — tylko na zakończonych świecach
- Właściwe przycinanie wieloramowe — linie kończą się na ostatniej zakończonej świecy HTF
- Ekstrapolacja oparta na nachyleniu dla spójnej projekcji kierunkowej
- Jasne serie wyjściowe z opisowymi nazwami poziomów
__________________________________________________________________________________________
WIĘCEJ DARMOWYCH WSKAŹNIKÓW
Odkryj szeroki zakres narzędzi analizy rynku — od struktury i wolumenu po regresję, zmienność i niestandardowe ramy czasowe.
Kod źródłowy jest dostępny w repozytorium GitHub.
Wszystko darmowe do użytku. Ale jeśli chcesz wesprzeć kawą, możesz to zrobić tutaj.
Wsparcie/Oporność
Wolumen
- Profiler Aktywności Wolumenu
- Analizator Efektywności Wolumenu
- Analiza Profilu Wolumenu
- Profil Wolumenu - Aktualizacja
- Analiza Rozkładu Wolumenu
- VWAP (Wolumenowo ważona średnia cena)
Średnie Ruchome
- Kanał SSL
- Zakotwiczona średnia ruchoma
- Średnia ruchoma skalowana odchyleniem
- Aktywator Ganna High Low
- Natychmiastowa linia trendu
- Adaptacyjna MA Kaufmana z Trend Vision
- Kanał średniej ruchomej
- Pakiet średnich ruchomych
- Średnia ruchoma kanału trendu
Narzędzia/Niestandardowe
Oparte na Regresji
Zmienność
Oscylatory
__________________________________________________________________________________________
ZASTRZEŻENIE
Handel wiąże się z ryzykiem. Ten wskaźnik jest przeznaczony wyłącznie do analizy technicznej — zawsze stosuj odpowiednie zarządzanie ryzykiem i handluj odpowiedzialnie.
OPINIE I ULEPSZENIA
Jeśli masz sugestie, prośby o funkcje lub pomysły na ulepszenia, zostaw komentarz na karcie Dyskusja. Twoja opinia pomaga ulepszyć wskaźnik dla wszystkich.
Podsumowanie
It offers multi-timeframe analysis across 16 periods (from 1 minute to monthly), enabling regression calculations on higher timeframes displayed on the current chart with smooth interpolated rendering. Users can select among three calculation modes: Period-Based (rolling window), Date Range (custom start/end with timezone-aware parsing), and Multi-Timeframe. Channel width is adjustable via a standard deviation multiplier to reflect market volatility.
The indicator features real-time dynamic updates, optimized caching for performance, and extend-to-infinity trendline projections for forward-looking analysis. Visual output is clean, with slope-based extrapolation and no calculations on forming bars. This tool is designed for traders analyzing mean reversion and complex price structures across various market conditions.


![Logo „[Hamster-Coder] Bollinger Bands”](https://cdn.ctrader.com/image/webp/21d8e5d6-fb11-4bac-b9ee-cd05c2b76804_30327)
