present
Sign up and get $50 off your first purchase
Trading product for Heikin Ashi Candlestick Indicator Forex Crypto, image 1
Heikin Ashi Candlestick
Indicator
2 downloads
Version 1.0, Sep 2025
Windows, Mac
Trading product for Heikin Ashi Candlestick Indicator Forex Crypto, image 2
Trading product for Heikin Ashi Candlestick Indicator Forex Crypto, image 3
Since 15/06/2025
767
Free installs

Description

Heikin Ashi Candlestick Indicator

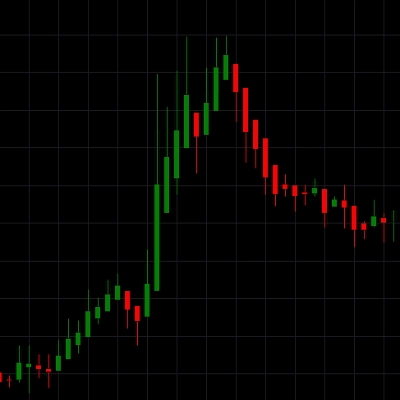
This indicator displays Heikin Ashi candles directly on your chart.

Installation:

  • Drag indicator onto desired chart.
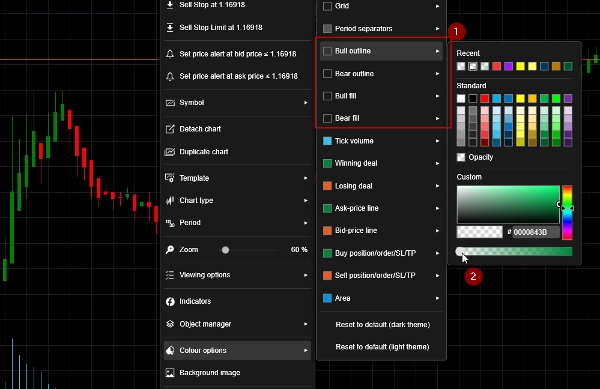
  • Right click on chart select "Colour options".
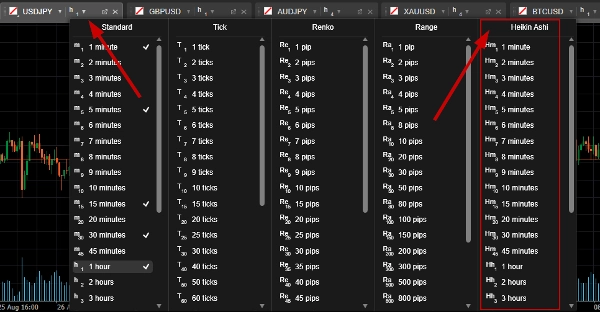
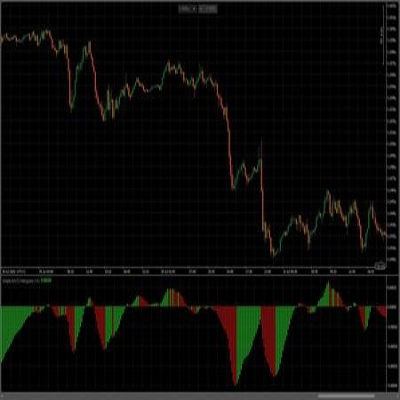
  • Set Bull Outline, Bull Fill, Bear Outline and Bear Fill to "Transparent". See the screenshot 1.

To show Heikin Ashi candles without indicators, see screenshot 2.

Summary

AI summary
The Heikin Ashi Candlestick indicator displays Heikin Ashi candles directly on trading charts. It modifies traditional candlestick visuals to provide a smoothed representation of price action, which can help in identifying trends more clearly. Installation involves dragging the indicator onto the desired chart and adjusting color settings to make the standard candle outlines and fills transparent, allowing the Heikin Ashi candles to be prominently displayed. This indicator is applicable across multiple markets including Forex, cryptocurrencies, and stocks. It integrates seamlessly with existing chart setups to enhance visual analysis without altering underlying price data.
Indicator profile

Customer reviews

0.0
Reviews: 0
Customer reviews
No reviews for this product yet. Already tried it? Be the first to tell others!

Discussion

FAQ

Forex
Crypto
Stocks
Products available through cTrader Store, including trading bots, indicators and plugins, are provided by third-party developers and made available for informational and technical access purposes only. cTrader Store is not a broker and does not provide investment advice, personal recommendations or any guarantee of future performance.
More from this author

Indicator
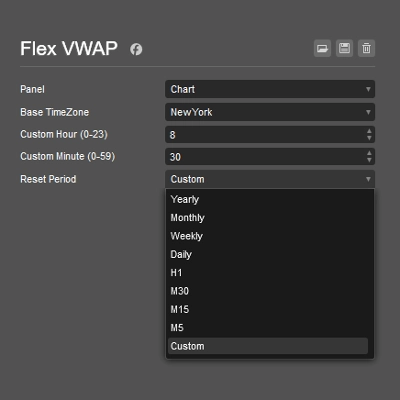
Flexible VWAP indicator with timezone-aware, custom time periods and automatic DST handling.
Indicator
Simple MACD Histogram with color-coded rising (green) and falling (red) momentum bars.

You may also like

Indicator
Moving Average
An Indicator made for scalping. Shows you the Sniper movement on Chart with the colour signals.
Indicator
Imbalance
Fair Value Gap
+1
Multi-symbol, multi-timeframe Fair Value Gaps in one panel.
"ORB v1" logo
Popular
5.0
(3)
$19
Indicator
Breakout
Opening Range Breakout (ORB) - Visual Edition
Indicator
ATR
RSI
+5
Multi-factor VWAP mean-reversion signals with ATR bands, volume exhaustion, and RSI gate on cTrader.
"IVB 2.0" logo
Top-rated
4.6
(5)
$19
Indicator
IVB 2.0 is an indicator that works on the strategy of imbalance of the maximum volatility box of indices
Indicator
Breakout
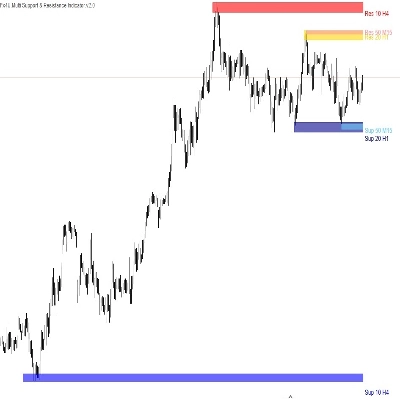
Allow trader to visualize Support & Resistance across different timeframes,give trader an overview of the current market
Indicator
Forex
BTCUSD
+5
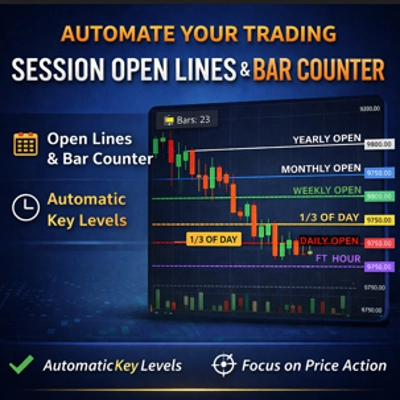
Auto-plots Open, High, and Low of Day/Week/Month/Year. Session candle counter + Round Numbers. Fully customizable
Indicator
RSI
Forex
+4
New version of one of my favorites includes Fibonacci and moving average convergence divergence lines
Indicator
Forex
BTCUSD
+11
Catch High-Probability Reversals with Precision Swing
Indicator
Prop
Forex
+15
ZigZag Free is a clean swing-detection tool that marks significant pivot highs/lows
Indicator
Smart Signal Reversal Trend + Patterns
Indicator
Drawdown Monitor
Proprietary trading desk risk monitoring dashboard!
"VWAP Pro" logo
Top-rated
5.0
(6)
Free
Indicator
VWAP
Forex
Advanced VWAP with up to 30 anchored levels, multiple timeframes, memory mode, standard deviation bands & simple GUI
Indicator
VWAP
Volume
+5
Multi VWAP. Three timeframes. One clean chart. Your Essential Trading Tool.
Indicator
Forex
BTCUSD
+10
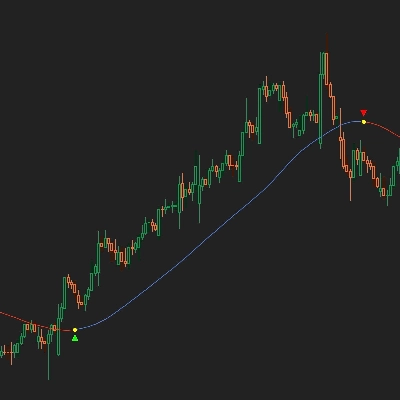
6-stage IIR filter trend indicator with colored line segments, reversal signals, alerts, and entry arrows.
Indicator
Boost your trading with Candlestick Patterns for cTrader – auto-detect key signals for smarter, faster decisions!
Indicator
RSI
RSI on the main chart with 45/55 momentum levels, overbought/oversold levels, averaged RSI, and multi-timeframe support.
Indicator
BOS
Key Levels
+3
Pivot-based Support and Resistance levels that extend until broken, with volume-confirmed break signals

Price

Since 15/06/2025
767
Free installs