🚀 Características principales
Análisis multidimensional de liquidez
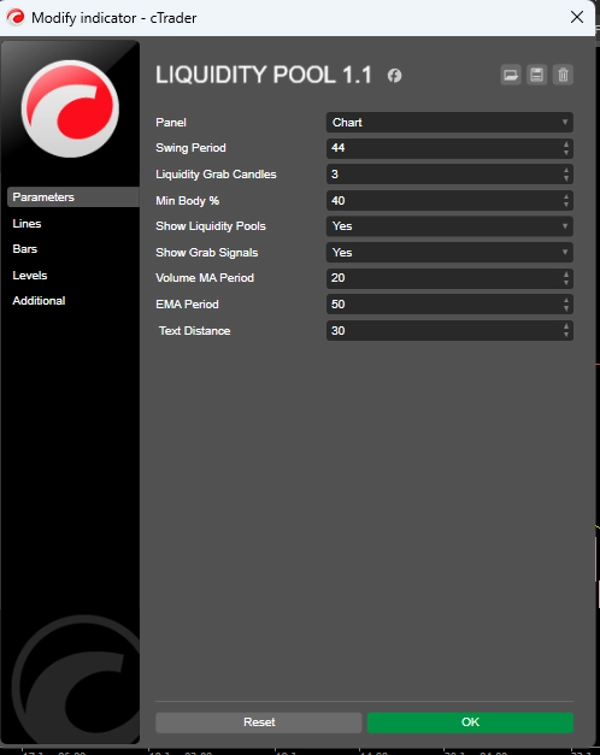
Detección de máximos/mínimos oscilantes con marco temporal personalizable
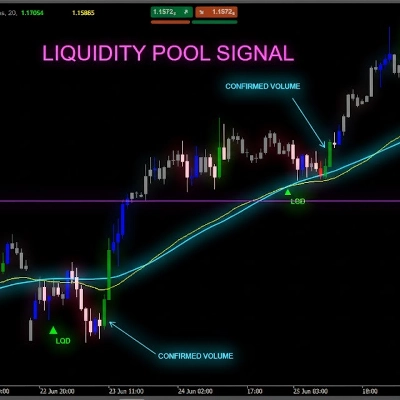
Identificación visual de piscinas de liquidez con iconos y texto
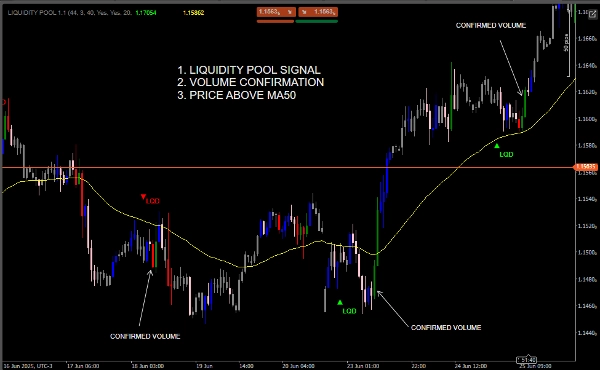
Señales de captura de liquidez con confirmación de volumen
Análisis del perfil de volumen (PVA)
Coloreado inteligente de velas basado en volumen relativo
Clasificación de volumen: alto, medio y bajo
MA de volumen para comparación de referencia
Sistema de señales integrado
Señales visuales claras (flechas y puntos coloreados)
Filtro EMA para confirmación de tendencia
Estrategia detrás del concepto: mostrar señales de captura
Trampa de liquidez: los grandes jugadores mueven el precio para capturar liquidez de los traders minoristas
Reversión inmediata: después de capturar liquidez, el precio se revierte en la dirección opuesta
Confirmación de volumen: el indicador también analiza el volumen para validar los movimientos


![Logotipo de "[Stellar Strategies] MARSI Signal Plotter"](https://cdn.ctrader.com/image/webp/7b2b8da6-8f8e-4646-8d4a-4710c516c01e_25567)


