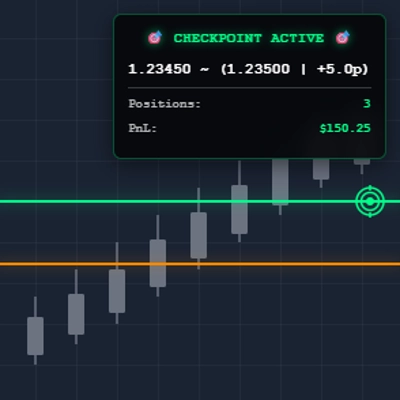
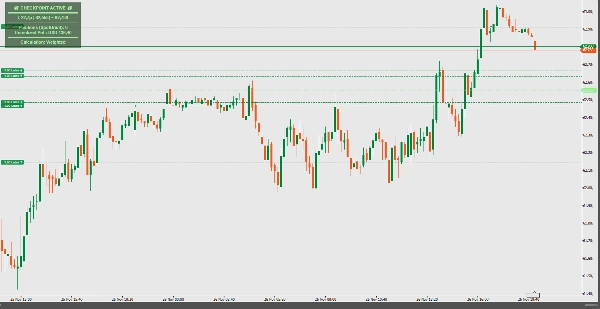
Indicador de Ponto de Verificação
Calculadora inteligente de preço médio para gerenciamento de múltiplas posições. Exibe níveis de equilíbrio em tempo real com feedback visual dinâmico. Perfeito para traders que gerenciam múltiplas entradas em qualquer instrumento.
Principais Características:
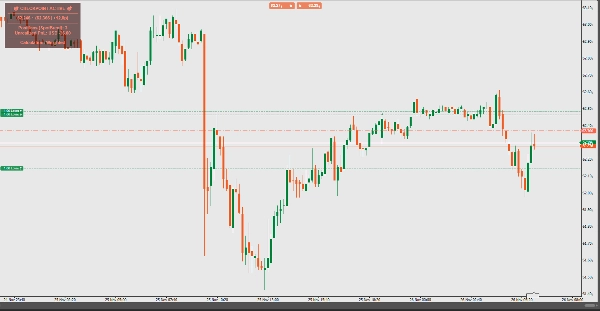
- Cálculo de média ponderada em tempo real
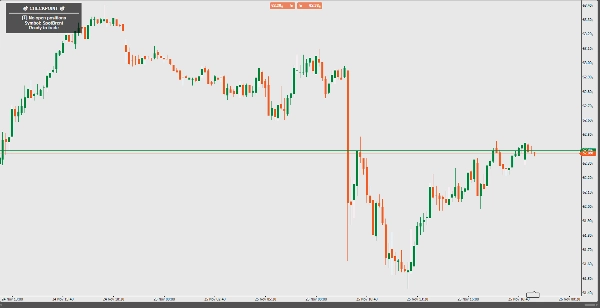
- Exibição inteligente da linha (mostra apenas com 2+ posições)
- Coloração dinâmica baseada em PnL (verde/vermelho/branco)
- Indicador de força em pips a partir do preço atual
- Painel de informações limpo e profissional
- Desempenho sem atraso
Como Funciona:
Calcula automaticamente o preço médio da sua posição usando o método baseado em volume ponderado ou média simples. O indicador exibe uma linha horizontal clara marcando seu ponto de equilíbrio quando você tem múltiplas posições, ajudando você a tomar decisões de negociação informadas com base na saúde geral da sua posição.
Perfeito Para:
- Traders de posição escalando entradas/saídas
- Gerenciamento de portfólio entre instrumentos
- Gerenciamento de risco e colocação de stop-loss
- Visualização do ponto de equilíbrio da sua conta de negociação
Basta aplicar em qualquer gráfico e deixar o Checkpoint cuidar do resto - seu ponto de verificação de negociação simplificado!


